🚚 Supply Chain
In the supply chain section, you can access for free the 65+ articles of my medium blog followed by 3.2k+ people with:
- A statement of the problem to solve based on an actual project
- Introduction of the mathematical concept used to solve the problem
- Implementation using Python, VBA or javascript
The goal is to provide all the keys to understanding the concepts and everything you need to adapt the solution to your problem.
❓ Purpose
It all started with problems faced by operations, a customer request for solution design or mathematical concepts I learned.
🚀 Introduction Article
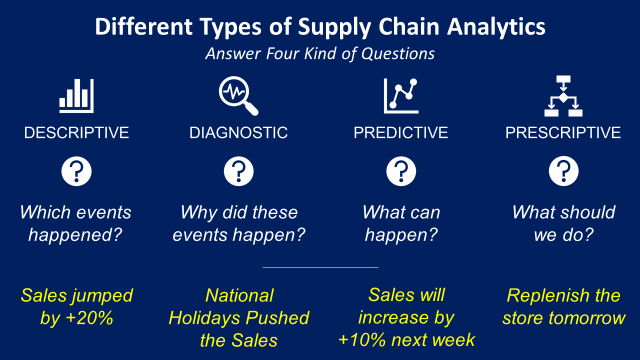
What is Supply Chain Analytics?

🌳 Sustainable Supply Chain
Use Data Analytics to measure the environmental impact of your supply chain and support initiatives for a green transformation roadmap.

- 📈 Data Analytics for Supply Chain Sustainability
- 🗑️ Sustainable Logistics - Reduce Warehouse Consumables
- 📊 Supply Chain Sustainability Reporting with Python
- ♻️ What is a Circular Economy?
- 📐 What is a Life Cycle Analysis?
- 🗑️ Sustainable Logistics - Reduce Warehouse Consumables
- ♻️ Data Analytics for Circular Economy
- 👗 How Sustainable is Your Circular Economy?
- 🚛 Case Study for Green Inventory Management
- 🏭 Data Analytics for Sustainable Sourcing
Find all articles in this section ➔

📦 Warehousing Operations
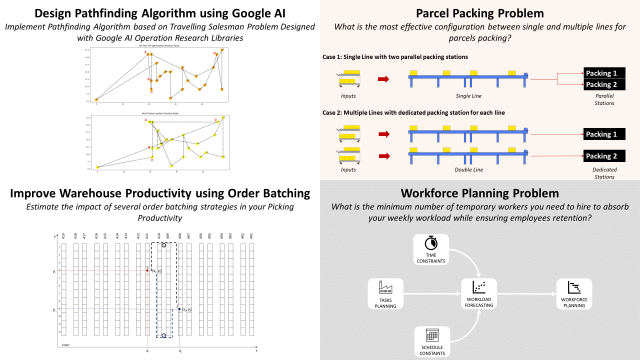
I started my career designing warehousing solutions (layout, inbound/outbound process, ...).

Therefore, the first articles focus on solutions to answer operational issues occurring in a warehouse.
- 👷♂️ Supply Chain Process Design using the Queueing Theory
- 🤖 Deep Reinforcement Learning for AGV Routing
- 🔗 Reduce Warehouse Space with the Pareto Principle using Python
- 👜 Optimize Warehouse Value Added Services with Python
- 👷♂️ Optimize Workforce Planning using Linear Programming with Python
- 📦 Improve Warehouse Productivity using Pathfinding Algorithm with Python
- 📦 Improve Warehouse Productivity using Spatial Clustering with Python
- 📦 Improve Warehouse Productivity using Order Batching with Python
Find all articles in this section ➔

🚛 Transportation Operations
If you want to reduce lead times or cut logistic costs, transportation optimization is the easiest way.

- 🕸️ Transportation Network Analysis with Graph Theory
- 🚚 Optimize E-Commerce Last-Mile Delivery with Python
- 📦 Containers Loading Optimization with Python
- 🤖 Build a Shipment Tracking Tool using a Telegram Bot
- 📊 Road Transportation Network Visualization
Find all articles in this section ➔

🔗 Supply Chain Optimization
A step further is to leave the local scope of a warehouse and approach the problem from a Supply Chain point of view.

Improve your overall end-to-end performance by optimizing DC Networks, Supply Planning, Inventory Management or anything related to the flow of goods.
- 📈 What Is a Supply Chain Digital Twin?
- 📊 What is Supply Chain Analytics?
- 🏭 Production Fixed Horizon Planning with Python
- ⛓️ Robust Supply Chain Networks with Monte Carlo Simulation
- 📊 Inventory Management for Retail — Periodic Review Policy
- 📈 Product Segmentation for Retail with Python
- 💰 Procurement Process Optimization with Python
- 🔗Supply Planning using Linear Programming with Python
- 🏭 Raw Materials Optimization for Food Manufacturing with Python
- ⛓️ Supply Chain Optimization with Python
Find all articles in this section ➔

📊 Reporting and Automation
Automate the tasks of data extraction and processing from ERPs, WMS or unstructured data using Visual Basic or Python.

- 🗼 Automated Supply Chain Control Tower with Python
- 💠 4 Smart Visualizations for Supply Chain Descriptive Analytics
- 📉 Deploy Logistics Operational Dashboards using DataPane
- 💹 Build Interactive Charts using Flask and D3.js
- 🦾 Build a Shipment Tracking Tool using a Telegram Bot
- 👩💼 SAP Automation for Retail
- 👩💼 SAP Automation of Orders Creation for Retail
- 👩💼 SAP Automation of Product Listing for Retail
Find all articles in this section ➔

⛩️ Lean Six Sigma
Lean Six Sigma (LSS) is a method based on a stepwise approach to process improvements.

This approach usually follows 5 steps (Define, Measure, Analyze, Improve and Control) for improving existing process problems with unknown causes.
- ⛩️ Lean Six Sigma with Python — Chi-Squared Test
- 📉 Statistical Sampling for Process Improvement using Python
- ⛩️ Lean Six Sigma with Python — Logistic Regression
- 🔰 Central Limit Theorem for Process Improvement with Python
- ⛩️ Lean Six Sigma with Python — Kruskal Wallis Test
Find the articles in this section ➔

📦 Inventory Management
For most retailers, inventory management systems take a fixed, rule-based approach to forecast and replenishment order management.

In this section, you can find insights and tips to optimize the inventory, forecast the demand and reduce stock-outs.
- 📉 Machine Learning for Retail Sales Forecasting — Features Engineering
- 📦 Inventory Management for Retail — Stochastic Demand
- 📦 Inventory Management for Retail — Deterministic Demand
- 📈 Machine Learning for Store Delivery Scheduling
- 📉 Machine Learning for Retail Demand Forecasting
Find all articles in this section ➔

📤 Logistic Performance Management
Implement operational indicators to measure the performance of your distribution network, audit your supply chain reliability and reduce incidents.

- 🔗 Lead Times Variability and Supply Chain Resilience
- 👷♂️ Supply Chain Process Optimization Using Linear Programming
- 🚚 Logistic Performance Management Using Data Analytics
Find all articles in this section ➔

📩 Get the articles by Email


