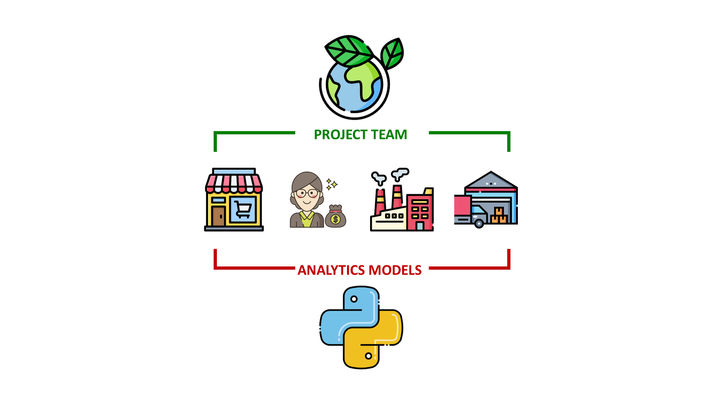
Business Planning with Python — Revenue Optimization
How can you use data analytics to help small businesses maximize their revenue while maintaining or improving profitability?
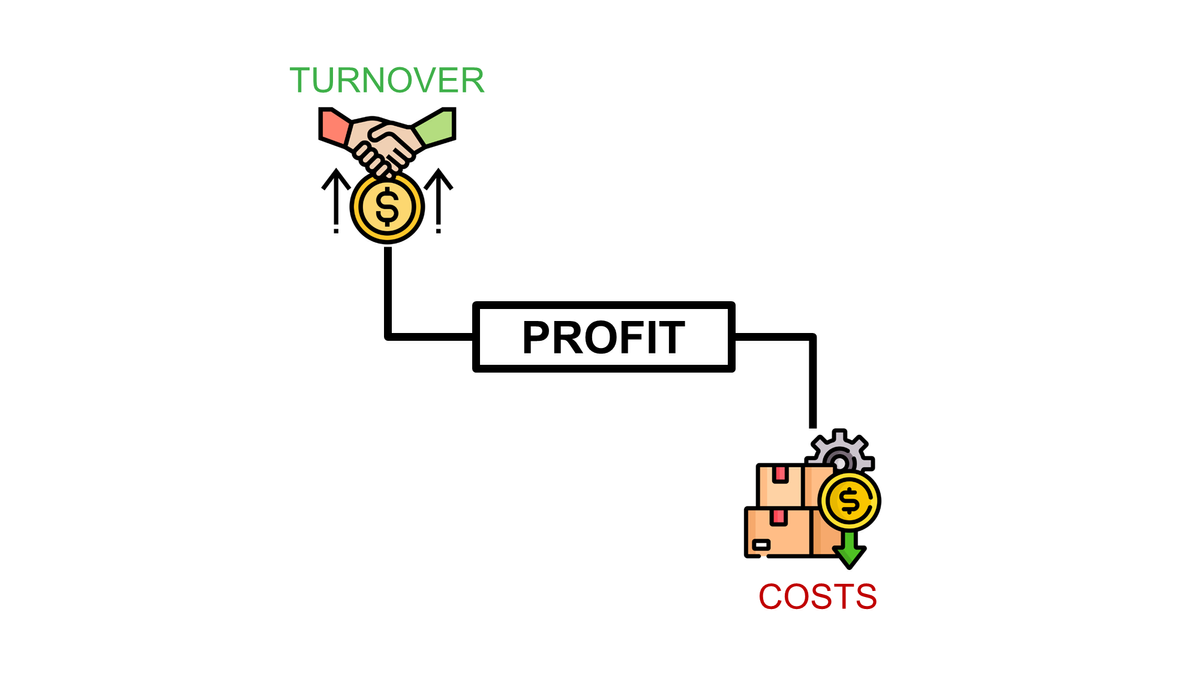
Revenue Optimization is the process of implementing strategies to maximize a company’s revenue while maintaining profitability.
In a previous article, we started to build a model that helps a small business owner (my friend) manage inventory and avoid liquidity issues.
Thanks to this model, we removed bottlenecks limiting business growth, like inventory and liquidity.
What is the optimal strategy to increase revenue growth without reducing profitability?
The focus now is on expanding the market and bringing additional revenue without endangering the business model.
This article will translate my friend's business plan into a model to simulate different scenarios to find the best growth strategy.
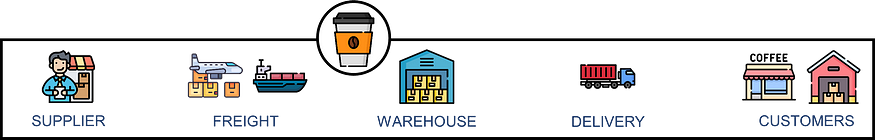
The case study is based on an existing small company selling cups (made from renewable materials) to coffee shops and distributors.
In the first section, we will update the model with new business and operational assumptions.
In the second section, we will test several price-led growth strategies and measure their impacts on profitability for different sales growth scenarios.
Adapt the model to the new business practice
1. Inventory Management Simulation
2. Degressive Tariff for Inbound Freight
3. Economies of Scale
4. Translating Business Ideas with Analytics
II. Revenue Optimization: Growth with Higher Profit
What is the best strategy to increase turnover with the same profitability.
1. Baseline & Profitability Indicators
2. Five growth scenarios for each pricing strategy
III. Conclusion
1. What is the best strategy?
2. Next Step: Go green
Business Planning Model
Before assessing the business growth strategies, we will update the model with additional business insights I’ve collected from my friend.
In the first article, I introduce the approach used to build a model of the value chain of a business selling renewable coffee cups.
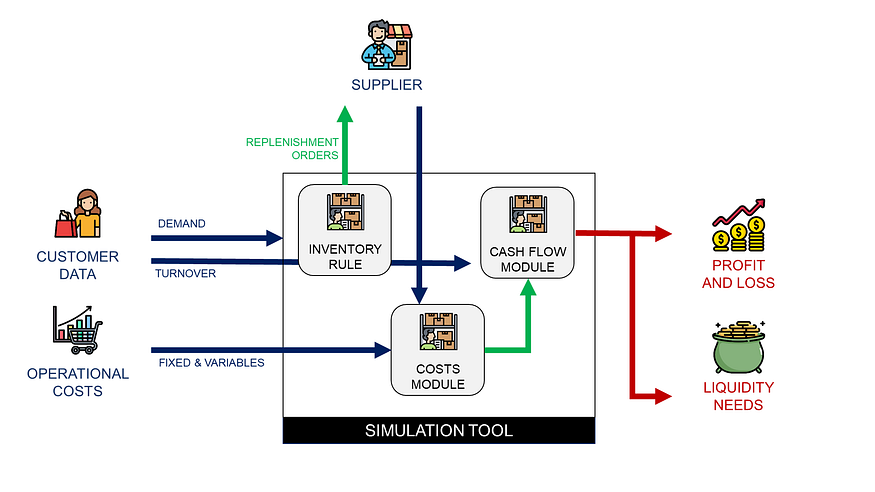
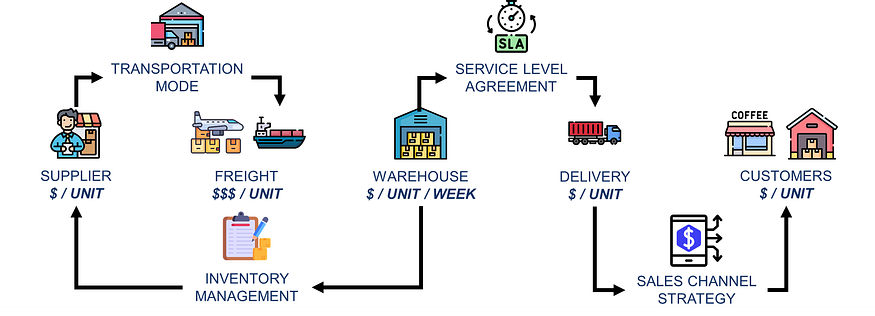
This model uses historical sales data, operational constraints, and cost information as input to estimate your business's profitability and cash flow.
It covers the full value chain from suppliers to customers.
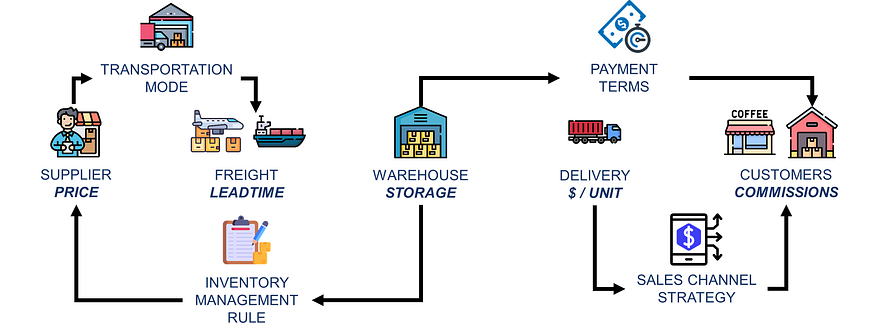
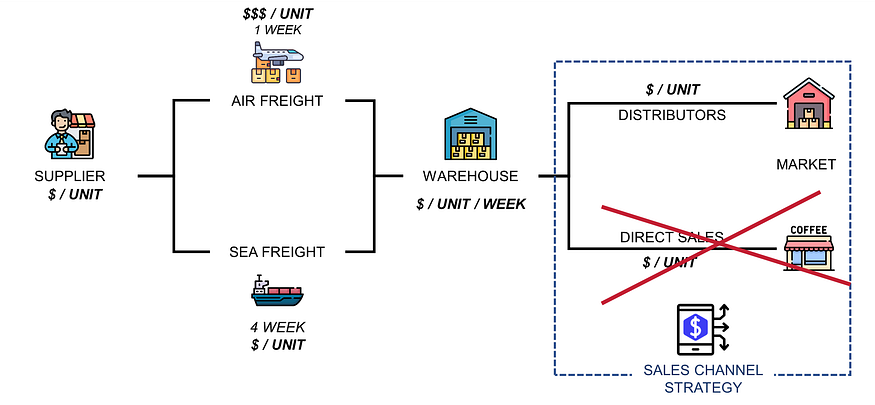
- An inventory management module that sends purchase orders to the suppliers based on customer demand and replenishment lead times.
- Inbound/outbound logistics flow modelisation with lead times and cost per handling units (pallets or cartons).
- Two sales channels (direct sales to coffee shops and distributors) have their own sales commissions (30% for direct) and payment terms.
What is the optimal business model?
We simulated the impacts of strategic business and operational decisions on profitability and liquidity needs for different scenarios.
- The initial scenario is the baseline (how they operate the business now).
- The following scenarios tested the impacts of reducing stock coverage, using air freight for inbound or selling to distributors only.
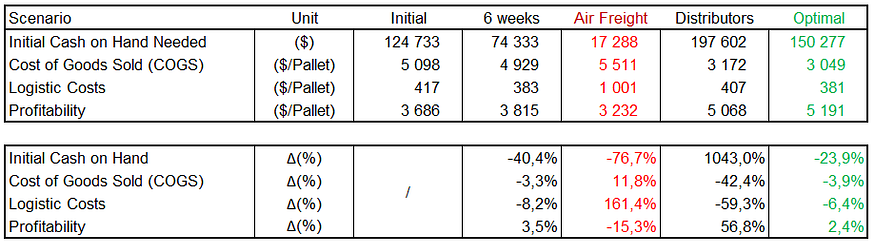
The conclusion was that the optimal strategy is to sell to distributors only with 6 weeks of stock coverage.
My friend: “We don’t check the inventory daily anymore, and we got a new deal with the freight forwarder”.
As the situation changed, we needed to update the model by
- Switching to a periodic review policy for inventory management.
- Updating the cost structure and payment terms of inbound logistics.
Inventory Management Simulation
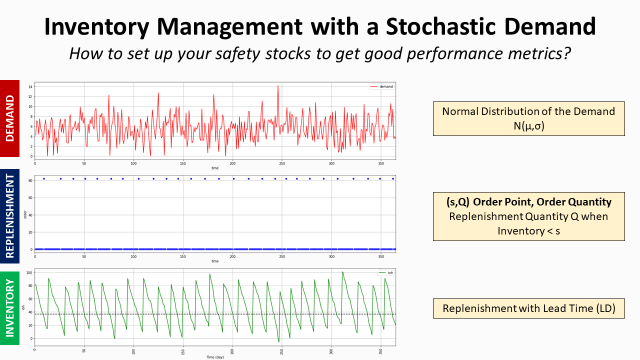
The initial model is based on a continuous review policy (s, Q) that triggers a replenishment order (Q) when the inventory is below the threshold (s).
This module uses the customer demand, replenishment lead times, and safety stock parameters to ensure we have the right inventory level.
However, my friend does not have a dedicated inventory team to monitor the stock daily.
We have limited resources to manage our stock and to order with the supplier.
Therefore, I adapted the model using a periodic review policy Order-Up-To-Level (R, S).
- Periodic review means that the inventory team reviews every R weeks.
- (R, S) means that the team orders the quantity required to reach inventory level S every R weeks.
Level S is the inventory you need to meet customers’ demands until the next review in R weeks.
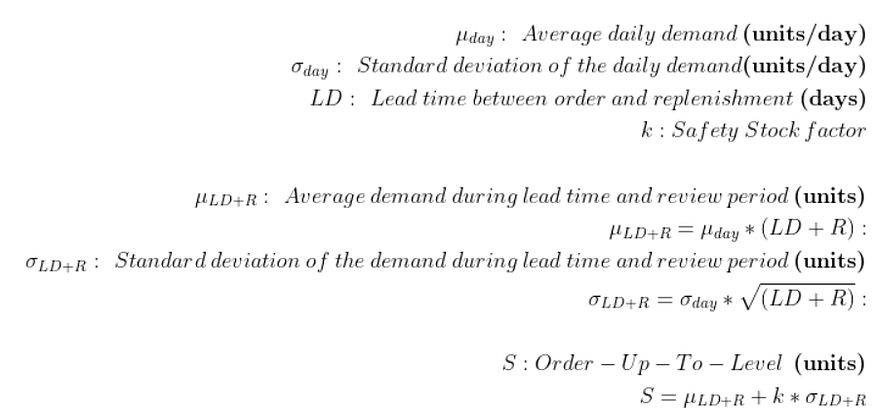
We define it using the replenishment lead time, a target cycle service level and the standard deviation of customers’ demand.

💡 For more details about the periodic review policy, check this article
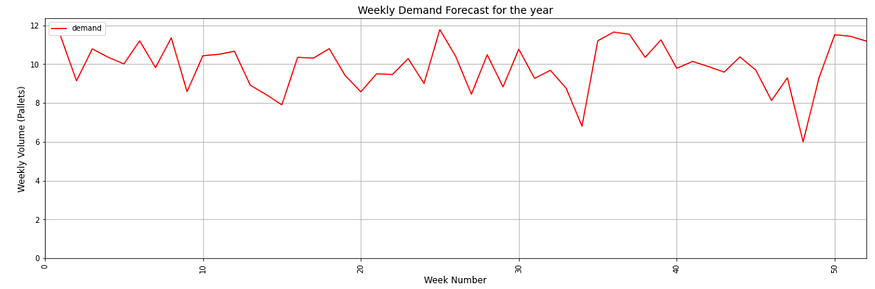
The results look like the chart below.
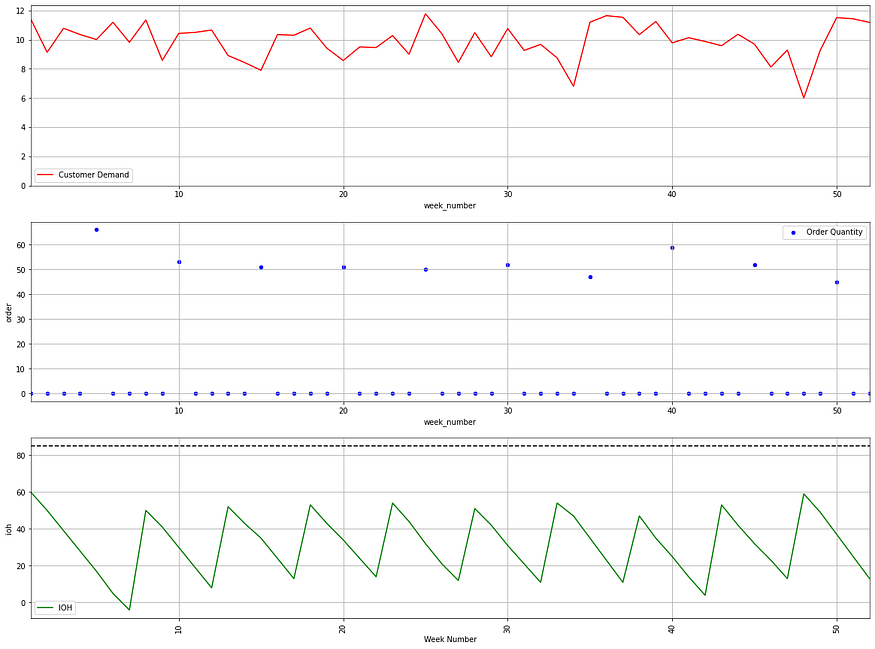
📈 Legend
- The blue plot represents the optimal policy with orders every 4 weeks.
- The green plot is the inventory on hand (ioh), i.e. the number of pallets stored in the warehouse.
Now that we have updated the inventory management module, we can focus on the inbound freight costs and lead time.
Degressive Tariff for Inbound Freight
After successful negotiations with the freight forwarder, they reached a favourable deal:
- Payment Terms: They can pay the forwarder 4 weeks after delivery
- Degressive tariffs with rebates when reaching specific thresholds.

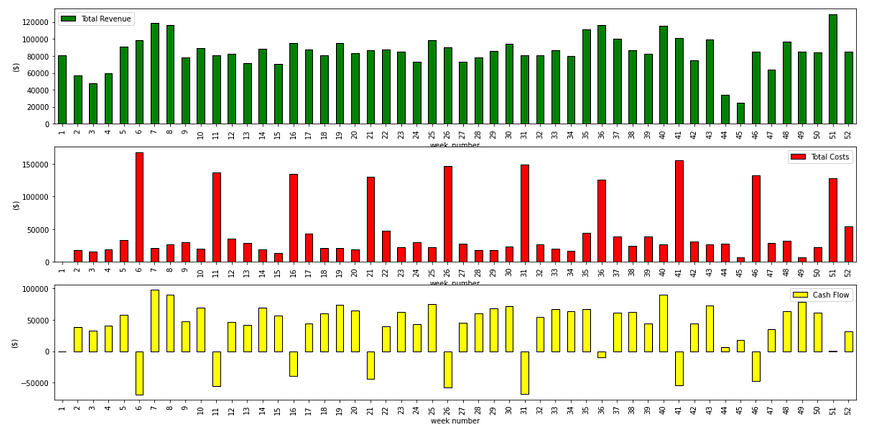
What is the impact on liquidity and profitability?
We update the calculation of inbound logistics costs with the rebate mechanism.
Here we are with some quick wins for the best scenario.
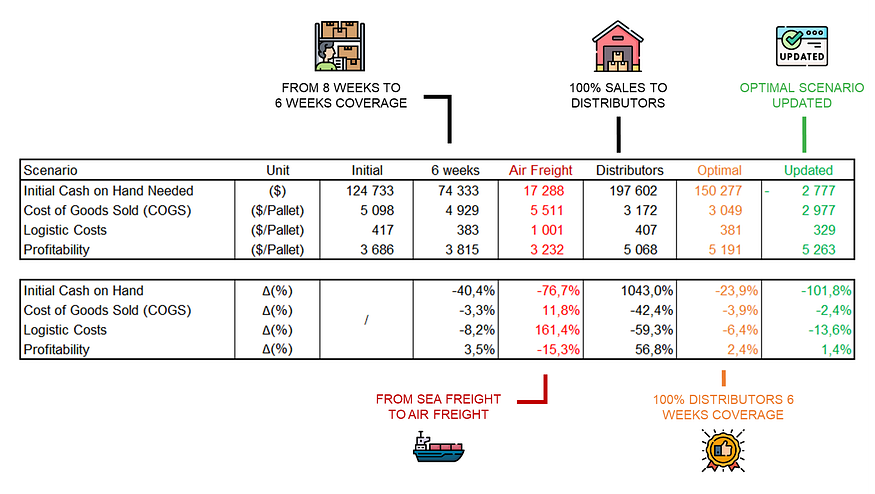
- No cash is needed anymore to sustain the business, thanks to new terms.
- 13.6% reduction in logistic costs driven by new freight tariffs, which results in a 2.4% reduction of the average cost of goods sold (COGS)
The chart below shows that we collect distributors' payments before paying suppliers and freight forwarders.
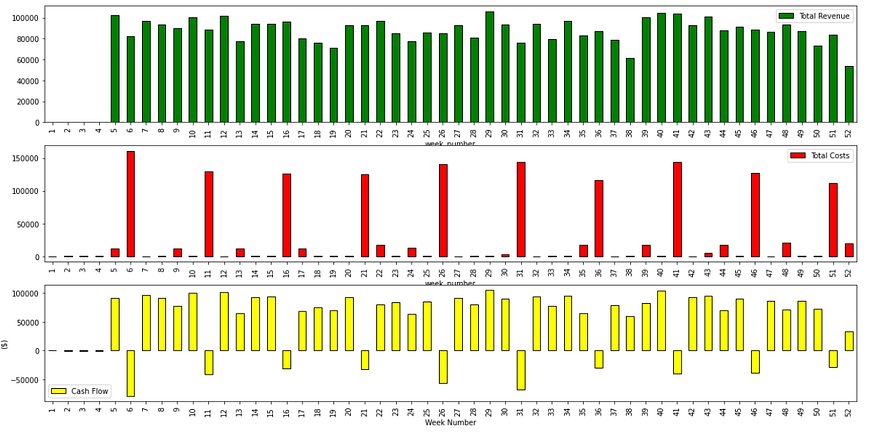
We have completely solved the liquidity issue for the optimal scenario only.
Samir: “What’s the next step?”
My friend: “We need to bring more revenue.”
To boost profitability, my friend would like to reduce the effect of fixed costs by boosting sales volumes.
Economies of Scale
Economies of scale refer to the cost advantages this business can achieve by increasing its sales volume, which reduces the fixed costs per unit.
These costs are linked to the company's structure and cannot be compressed.
However, if we boost sales and keep these fixed costs under control, we can reduce their impact on each box sold.
Revenue Optimisation: Growth with Higher Profit
After 24 months of activity, my friend found a business partner with 25 years of experience in the Food and Beverage industry.
My friend: “She brings investment and market expertise with the aim of boosting growth.”
She estimated the growth they could achieve if they followed specific commercial strategies.
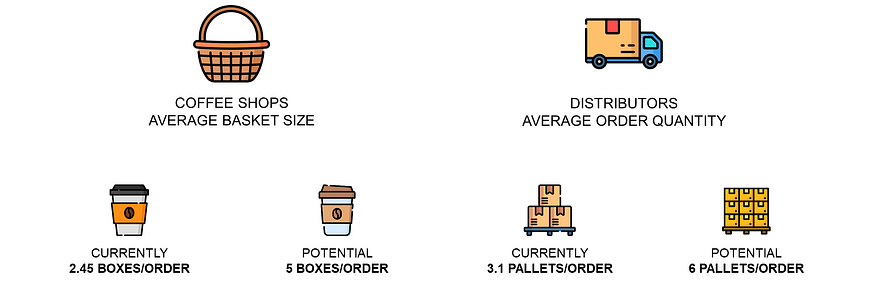
After analyzing the business model, she proposed to change the pricing mechanism to increase the average basket size.
My friend: “She wants to offer tiered pricing discounts to incentivize bulk purchases.”
However, the risk is to impact profitability and cause a liquidity crash as we reduce the turnover per box sold.
My friend: “If we implement strategy X, can you tell me how much growth we need to keep the same profitability?
For each strategy, we can use the model to estimate the minimal growth needed to improve profitability compared to the baseline.
Baseline & Profitability Indicators
For this analysis, we defined the baseline using the 2023 historical sales with updated terms and inventory management rules.
More than 70% of the turnover comes from direct sales to coffee shops, and the remaining is from distributors with four-week payment terms.
We don't have liquidity issues thanks to favourable payment terms with our suppliers and the coffee shops.
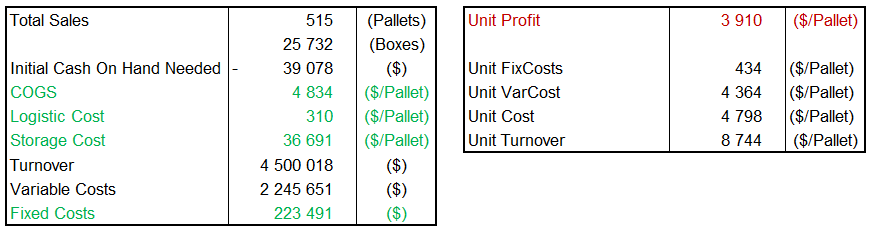
Considering fixed and variable costs, we can reach $3,910 in profit per pallet sold for this scenario.
This profitability is influenced by the green indicators that cover fixed and variable costs.
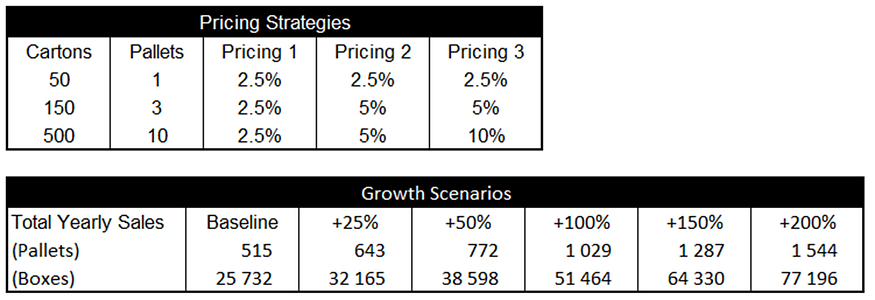
Five growth scenarios for each pricing strategy
My friend’s business partner based the pricing strategy on market practice and her industry knowledge.
The simulation aims to trigger data-based discussions to support business decision-making.
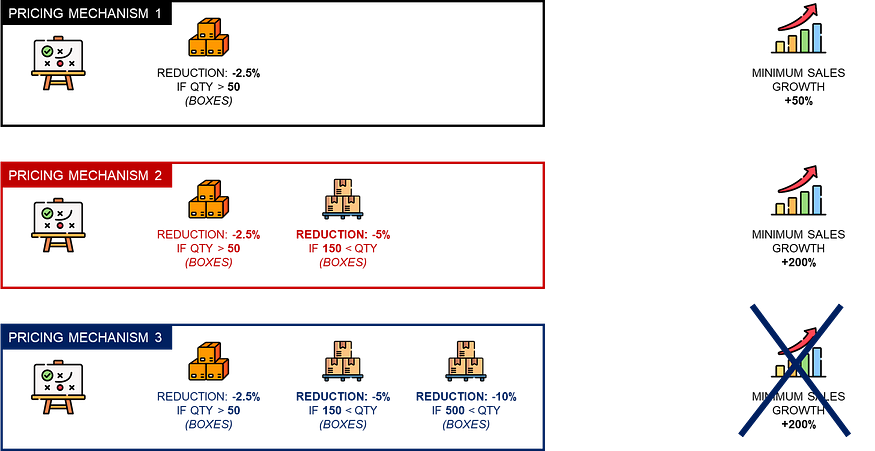
My friend: “If you want to apply Pricing 1, can we ensure that we have at least +50%? If not, we loose profitability.”
Let us start with the first pricing strategy.
Scenario 1: Low-risk pricing 1
This strategy incentivises customers to order at least a full pallet by providing a 2.5% reduction if the volume exceeds 50 boxes.
How much growth we need to maintain the same profitability?
As we can see in the rebate scenario, implementing the new pricing results in a profit loss of 171 ($/Pallet).
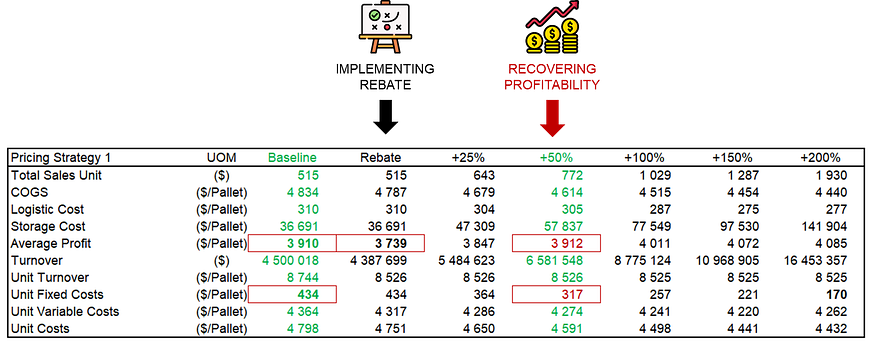
However, as sales growth mechanically decreases unit costs, this loss is compensated when we reach +50% growth.
- Variable costs are also reduced thanks to inbound flow optimizations.
- Storage cost per pallet increases due to the higher safety stock required.
They must bring at least 1.5 times the current turnover if she wants to implement this strategy.
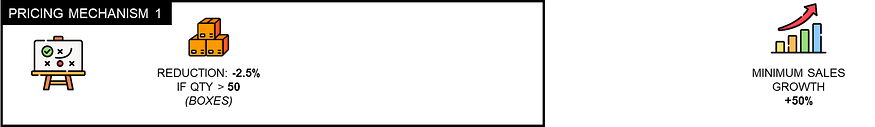
Business Partner: “We’ll never get more than 50% growth without an additional rebate. ”
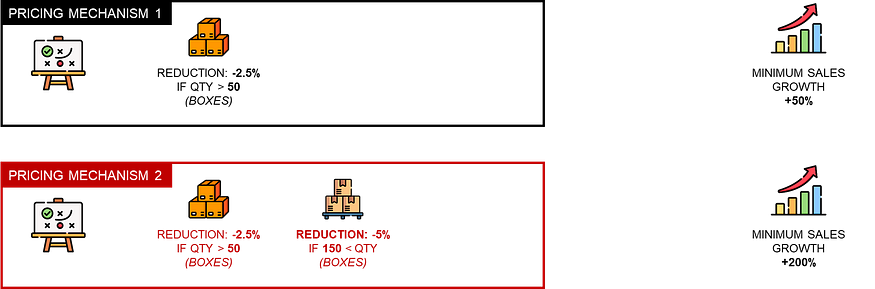
Scenario 2: Middle-risk Pricing 2
Indeed, the first pricing strategy does not incentivize ordering more than 1 pallet (50 boxes).
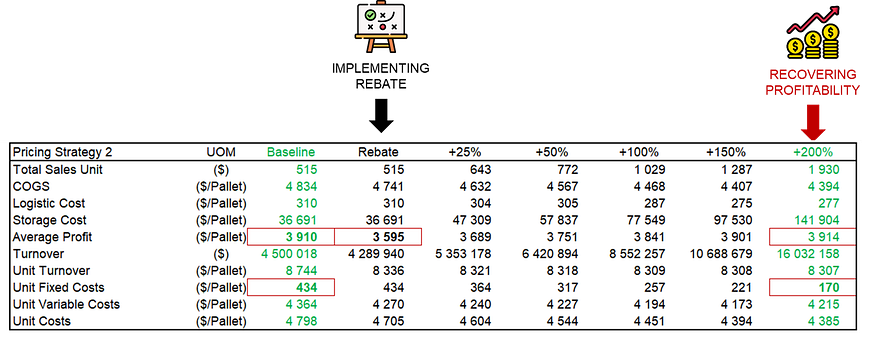
Therefore, they would like to add a 5% rebate if customers order over 150 boxes (3 pallets).
If we keep the same volumes, implementing this additional rebate induces a 315 ($/Unit) profitability loss.
Do we lose profitability if we only reach +50% growth?
Yes, we only get 3,751 ($/Unit) of profit with +50% growth vs 3,910 ($/Unit) for the baseline.
Therefore, we need at least +200% sales growth to recover the profitability level of the baseline scenario.
- Unlike the first pricing strategy, the turnover per pallet sold decreases until reaching a plateau after 100% growth.
- Cost of goods sold (COGS) is lower than under the first pricing strategy because the 30% sales commission for sales representatives is based on the invoiced amount.
We lose 171 ($/Pallet) of profit compared to the first pricing strategy if we reach +200% sales growth.
However, according to the business partner, this strategy is more likely to help us reach these targets.
My friend: “What if we implement another 10% for large orders?”
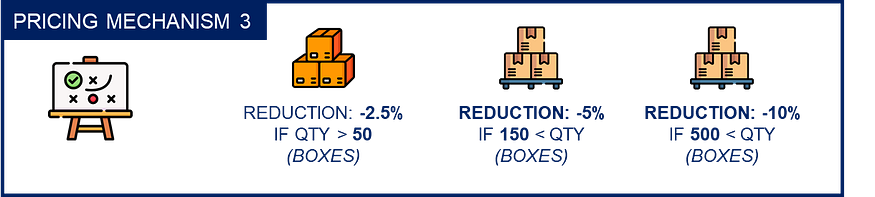
Scenario 3: High-risk Pricing 3
Even if this does not seem like a good idea, they want to estimate the profit loss with an additional 10% rebate for orders larger than 500 boxes.
Samir: “This brings interesting insights about your business.”
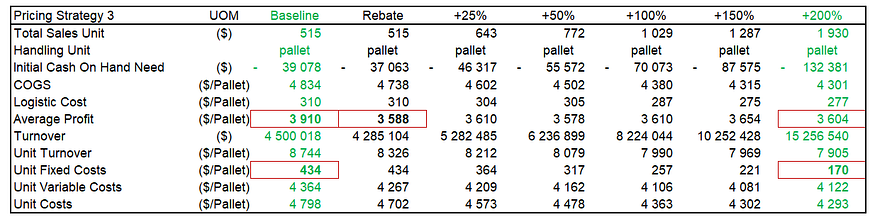
The slight reduction of profitability with the rebate scenario (from 3,595 $/pallet with strategy 2 to 3,588 $/pallet with strategy 3) shows that they currently have nearly no orders with a quantity higher than 500 boxes.
However, they will have a bad experience when their profitability decreases after reaching +50% growth.
Samir: You’ll never be able to reach the profitability level of the initial scenario.
The model provides data-driven insights on assessing the business partner's suggestions.
Translating Business Ideas with Analytics
This exercise exemplifies how translating business ideas based on intuition into actual figures is important for preserving margins and avoiding bankruptcy.
My friend is a former data scientist with a quantitative approach to business, which may not be compatible with the culture of the F&B industry.
What is the quantitative impact of your business decision based on your intuition?
This model supports dealing with his business partner when discussing a strategic approach by assessing ideas with an objective third-party judge.
Based on the simulation, if we choose pricing strategy 2, we need at least +50% growth. Can we make it?
I have started using data analytics for business decision-making with a small bakery that wanted to optimize its profitability.
At that time, it was a small exercise of using linear programming to provide strategic insights to a business owner.
What is the best set of items to sell to maximize profitability?
This modelling continues the journey of using data analytics to support strategic business decision-making.
Do you have examples of similar projects supported by data analytics?
Conclusion
What is the best strategy?
Based on the current order profile, I propose pricing strategy 2 until they reach 50% growth.
They then can focus on selling to distributors to avoid sales commissions.
This would enable us to set a better rebate, since cutting commissions saves 30% of turnover.
They could re-run the analysis with the distributors' order profiles to set updated sales growth targets.
Do you agree with this approach?
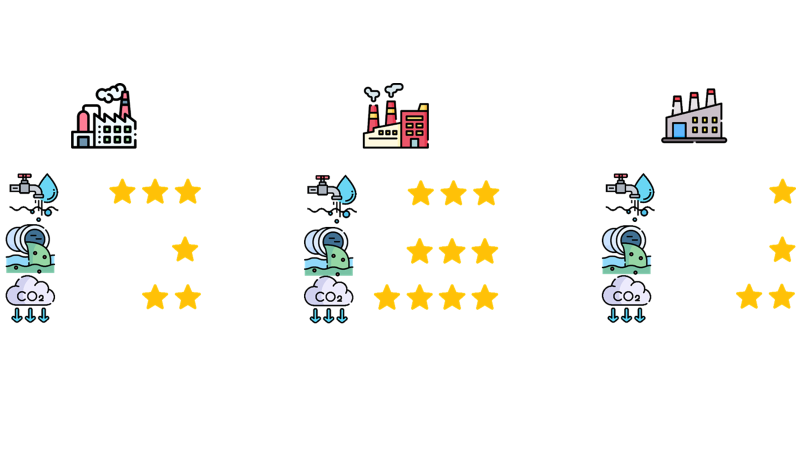
Next steps: Go Green!
My friend has been challenged by his customers to provide visibility on the environmental impacts of these renewable cups.
They advertise these cups as “sustainable”, with a “low environmental impact” and based on “fair trade”.
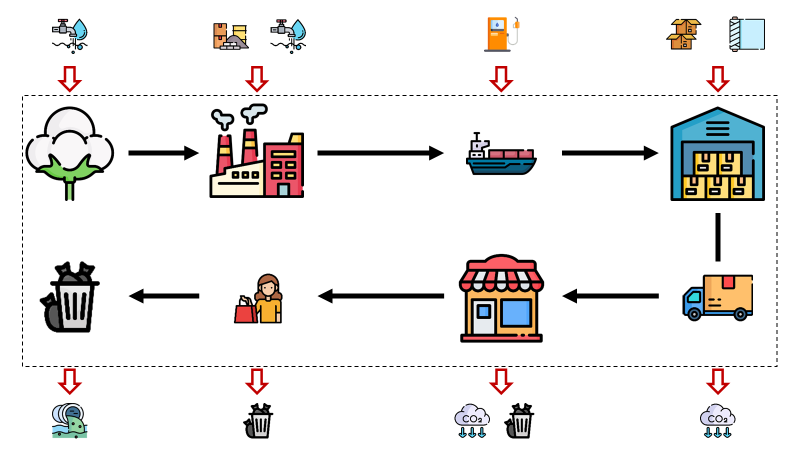
Therefore, we will begin estimating the environmental footprint of this activity along its value chain through a comprehensive Life Cycle Assessment (LCA).
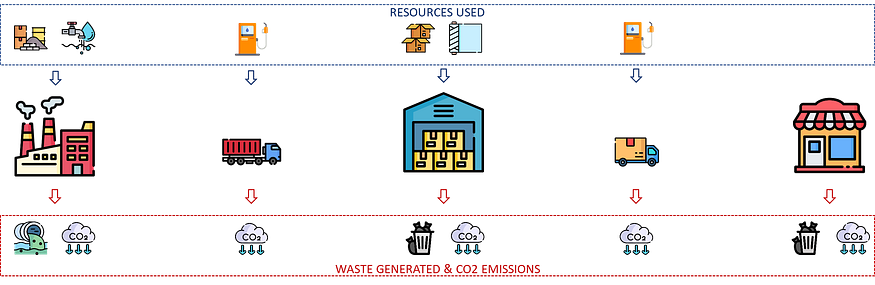
This will provide visibility of the impact of sourcing, storing and delivering these cups to our final customers.
How can we reduce this footprint? Select the right suppliers.
Sustainable sourcing is the approach of integrating social and environmental performance factors when selecting suppliers.
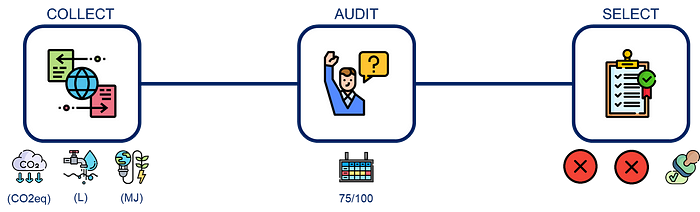
The objective is to build the right supply network based on
- The customer demand in different markets (Units/Month).
- A list of potential suppliers ( in different locations) with their production cost and environmental impact.
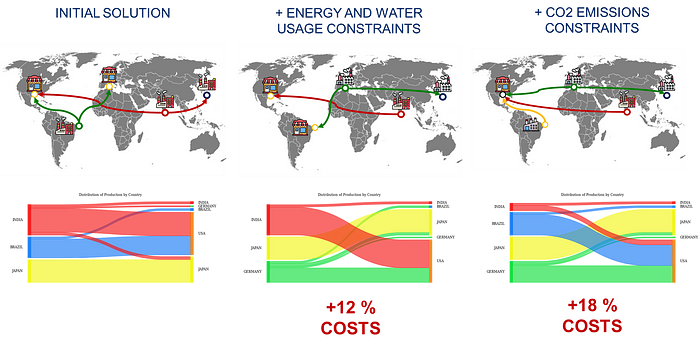
We will use linear programming in Python to select the optimal set of suppliers to minimise costs and reduce CO2 emissions or water use.
Finally, we will look at the distribution network and last-mile delivery using Green inventory management.
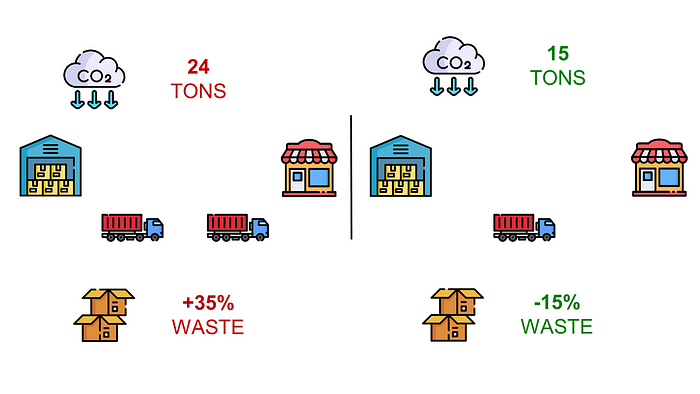
The idea is to manage inventory sustainably by incentivising the distributors to reduce their ordering frequency to maximise the volume per delivery.
More details in these articles,
- Life Cycle Assessment
- Sustainable Sourcing
- Green Inventory Management
- in Python to select the optimal set of suppliers to minimise costs and reduce CO2 emissions or water use
About Me
Let’s connect on LinkedIn and Twitter. I am a Supply Chain Engineer using data analytics to improve logistics operations and reduce costs.
If you’re looking for tailored consulting solutions to optimise your supply chain and meet sustainability goals, feel free to contact me.