Lean Six Sigma with Python — Kruskal Wallis Test
How to replace Minitab with Python to perform Kruskal Wallis Test evaluating the impact of training on warehouse operators’ productivity.
Lean Six Sigma (LSS) is a method based on a stepwise approach to process improvements.
This approach usually follows five steps (Define, Measure, Analyze, Improve and Control) for improving existing process problems with unknown causes.
In this article, we will explore how Python can replace Minitab (a software widely for LSS experts) in the Analysis step.
The idea is to use statistical tools to test hypotheses and improve the performance metrics of a specific process.
💌 New articles straight to your inbox for free: Newsletter
I. Problem Statement
Can we improve the operators' productivity by giving them a training designed by R&D team?
II. Data Analysis
1. Exploratory Data Analysis
Analysis with Python sample data from experiments with operators
2. Analysis of Variance (ANOVA)
Verify the hypothesis that training impacts productivityANOVA assumptions are not verified
3. Kruskal-Wallis test
Confirm that the hypothesis can be generalized
III. Conclusion
Problem Statement
Scenario
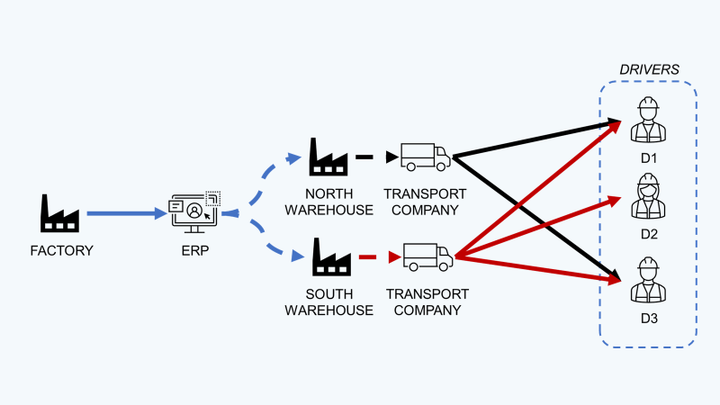
You are the Continuous Improvement Manager of a Distribution Center (DC) for an iconic Luxury Maison focusing on Fashion, Fragrances and Watches.
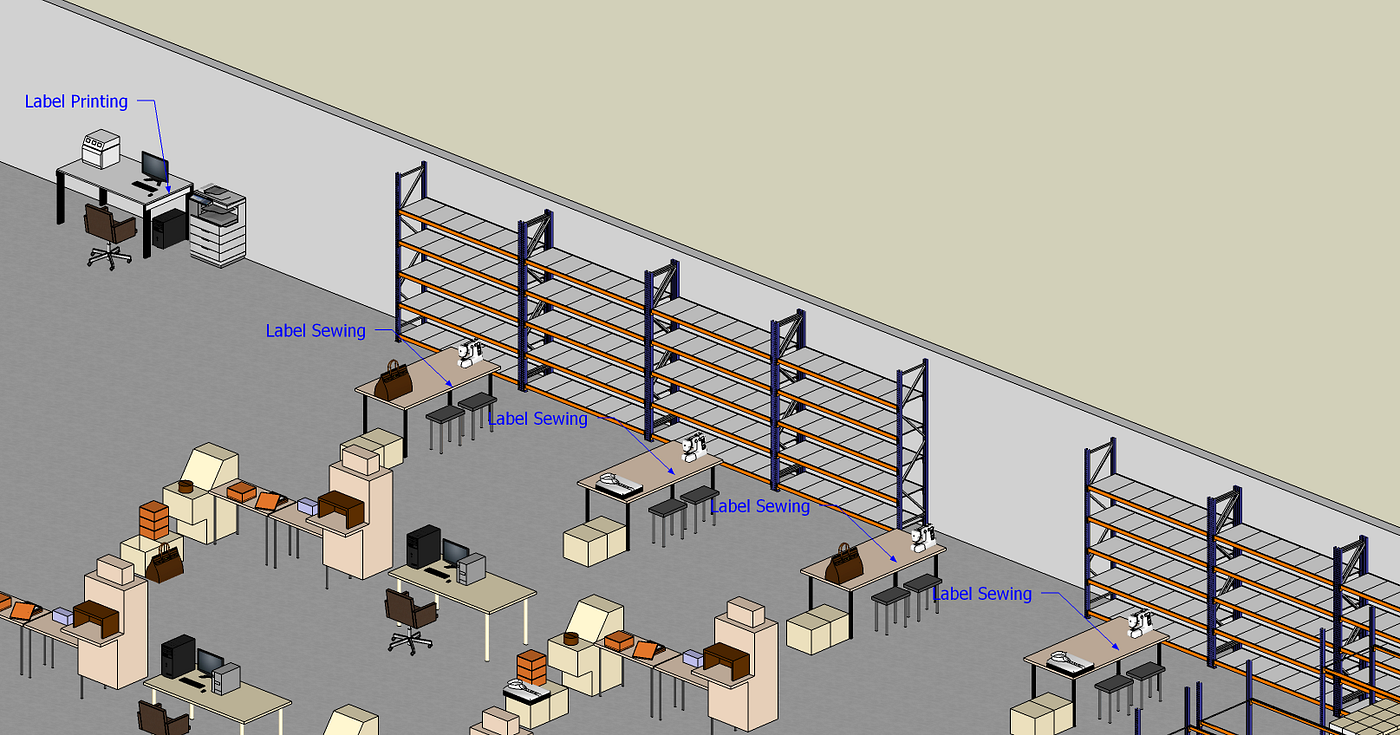
The warehouse receives garments that require final assembling and value-added service (VAS) during the inbound process.

For each dress received, operators need to print a label in the local language and perform label sewing.

In this article, we will focus on the improvement of label sewing productivity. Labels are distributed to the operators in batches of 30 labels.
The productivity is calculated based on the time (in seconds) needed to finish a batch.
You can find a YouTube version of this article with animations in the link below.
Impact of training your workforce
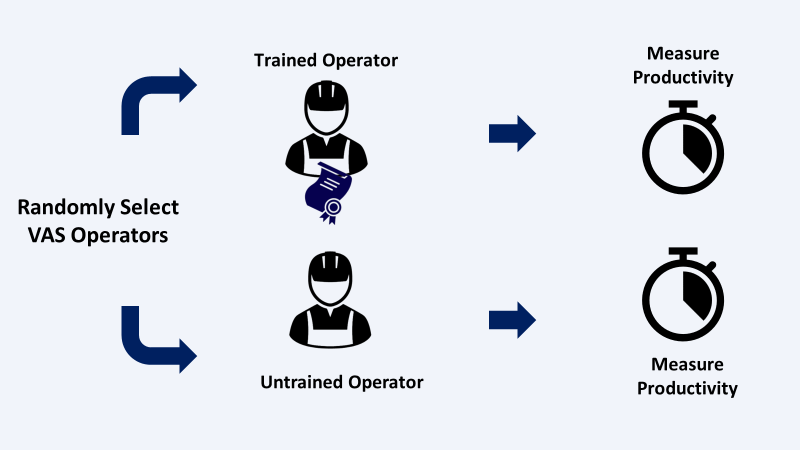
With support from the R&D team, you designed training for VAS operators to improve productivity and reduce quality issues.
Question
Does the training have a positive impact on operator productivity?
Hypothesis
The training has a positive impact on VAS operators' productivity.
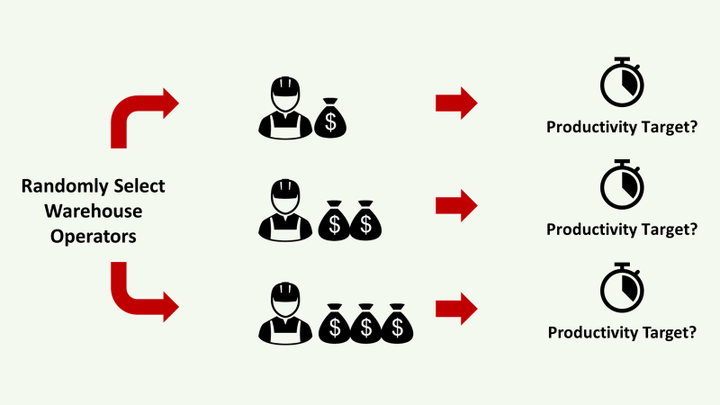
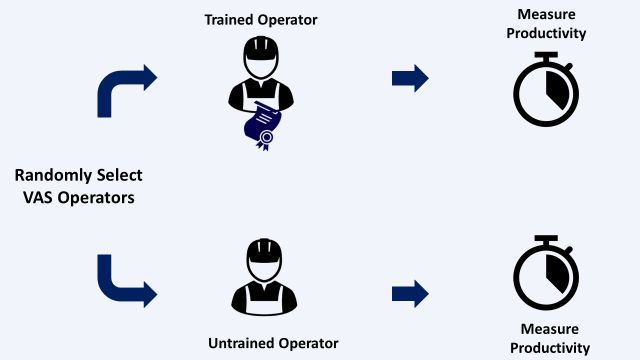
Experiment
Randomly select operators and measure the time per batch (Time to finish a batch of 30 labels in seconds) to build a sample of 56 records.
Data Analysis
Exploratory Data Analysis
You can download the CSV file containing the experiment results from my GitHub repository.
56 records
35 records of operators without training
21 records of operators with training
Box Plot
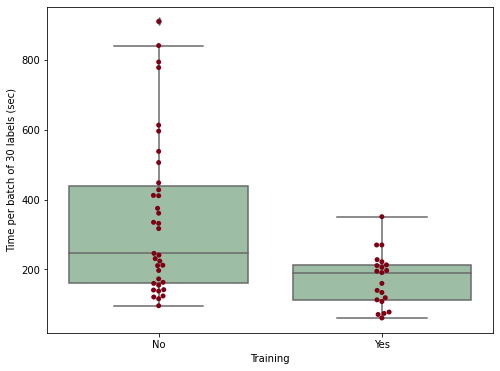
Based on the sample data, the median and mean are considerably lower for operators who received training.
Hypothesis
The training reduces the average batch time.
CodeMinitab
Analysis of Variance (ANOVA)
In this scenario, we want to check if the training (Variable X) is impacting the total time per batch (Variable Y).
Because X is a categorical variable (Training = Yes/No) and Y is numerical, the appropriate method is ANOVA.
ANOVA is a statistical method used to check if we can generalize the difference of means seen in the sample data to the entire population.
Step 1: Calculate the p-value
ddof: 11
ddof: 245.267
F: 17.1066
p-unc: 0.000151308
p: 20.173692
p-value is below 5%
CodeMinitab
Step 2: Validate the assumptions of ANOVA
Based on the p-value, we know that the difference of mean is real and not due to random fluctuation.
However, before jumping to a conclusion, we need to check that the ANOVA assumptions are satisfied
- Residuals are naturally distributed
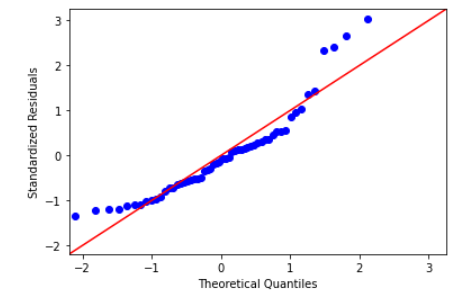
Answer: No
- There are no outliers or irregularities
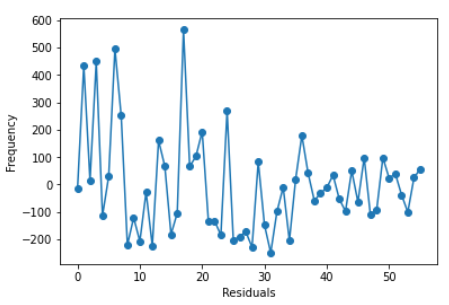
Answer: No
Conclusion
ANOVA requirements are not met.
We need another method to confirm that the training actually impacts operators' productivity.
CodeMinitab
Kruskal-Wallis test
If your sample data fails to meet ANOVA requirements, you can use the Kruskal-Wallis Test to check if the difference in means is due to random fluctuation.
pvalue = 1.205e-13
p-value is below 5%
Conclusion
The p-value is below 5%, so we can conclude that the difference of means is statistically significant.
We can confirm that the training has a positive impact on operator productivity.
CodeMinitab
Do you want to implement it?
Conclusion
This data-driven approach provided sufficient evidence to convince your management to invest in workforce training.
You provided insights with a moderate effort of experimentation by generalising patterns from sample data using statistics.
About Me
Let’s connect on LinkedIn and Twitter, I am a Supply Chain Engineer who is using data analytics to improve logistics operations and reduce costs.
If you’re looking for tailored consulting solutions to optimize your supply chain and meet sustainability goals, feel free to contact me.