Leveraging LLMs with LangChain for Supply Chain Analytics — A Control Tower Powered by GPT
Build an automated supply chain control tower with a LangChain SQL agent connecting an LLM with a database using Python.
Build an automated supply chain control tower with a LangChain SQL agent connecting an LLM with a database using Python.
A supply chain control tower is a centralized solution that provides visibility and monitoring capabilities to efficiently manage end-to-end supply chain operations.

In a prior article, I introduced a solution for an automated control tower that generates incident reports using Python.
How can we enhance this model for a better user experience?
Large language models (LLMs) could potentially provide tailored analysis based on each user's request.

Can we automate supply chain monitoring and diagnostics using Large Language Models LLM with Python?
In this article, I will share my journey to mastering Langchain with OpenAI’s GPT models and building the ultimate Supply Chain Control Tower using Python.
I. LLMs with LangChain for Supply Chain Analytics
1. Scenario: Distribution Process of a Fashion Retailer
The complex distribution operations in a global fashion retail setting.
2. Setting the Stage for Experimentation
Introduce the experimental setup to test a LangChain SQL agent.
3. Experimental Protocol: Starting Simple
Start with a straightforward query to assess the agent's basic capabilities.
II. Experiments and Key Insights
III. LLMs Shaping the Future of Supply Chain
1. What about GPTs? "The Supply Chain Analyst" Agent
2. A Simple 'Proof-of-Concept'
3. Continuing the Prototype Development
4. Exploring Broader Applications in Supply Chain
LLMs with LangChain for Supply Chain Analytics
Scenario: Distribution Process of a Fashion Retailer
Imagine you are a data scientist at an international clothing group with a global store network.
Your project involves assisting the distribution planning manager in monitoring the stores’ replenishment process.
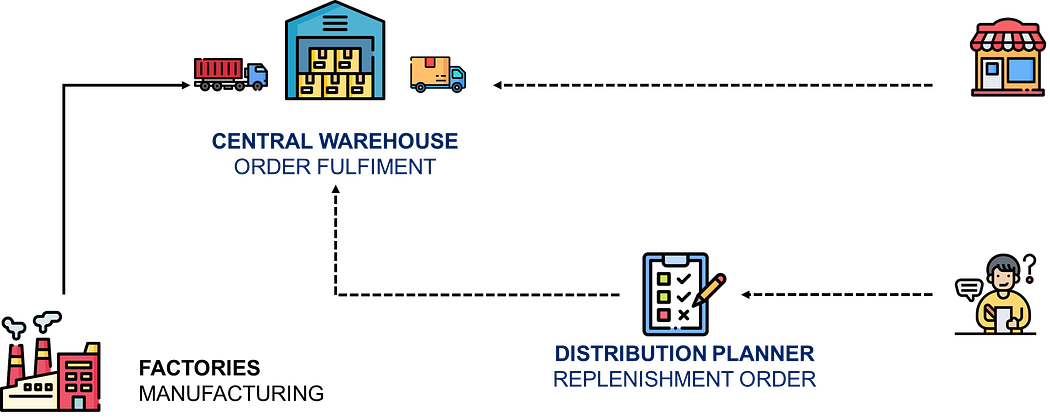
She leads a team of planners who manage the inventory of stores worldwide.
The process is simple: when the inventory level reaches the minimum level
- Planners create replenishment orders in the ERP with information like item quantities and requested delivery dates
- Operational teams at the Warehouse prepare the orders for shipment
- Transportation planners organize the delivery to the stores
The pivotal performance indicator is the on-time delivery rate.
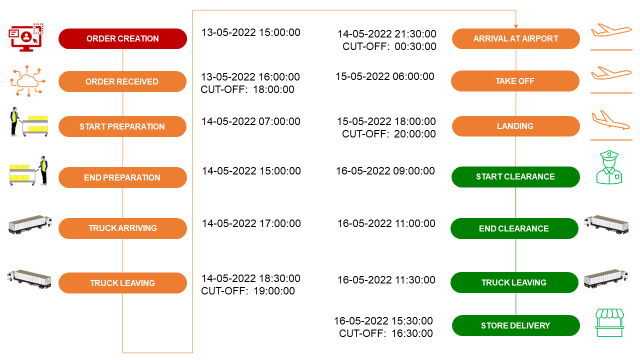
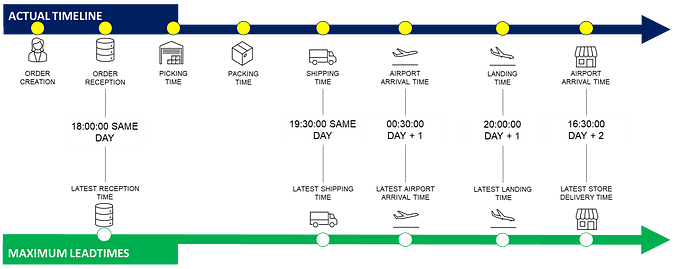
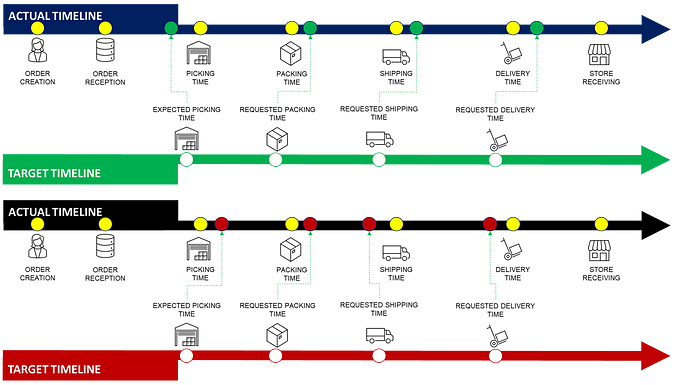
From the order creation to the store delivery, several timestamps and boolean flags are recorded in the database.
- Order Transmission time is recorded in ‘Transmission’
If this is after the cut-off time, ‘Transmission_OnTime’ is set to 0. - Truck Loading time is recorded in ‘Loading’
If this is after the cut-off time, ‘Loading_OnTime’ is set to 0. - Truck arrival at the airport is recorded in ‘Airport_Arrival’
If this is after the cut-off time, ‘Airport_OnTime’ is set to 0. - Aircraft landing at the airport is recorded in ‘Airport_Arrival’
If this is after the cut-off time, ‘Airport_OnTime’ is set to 0. - Truck arrival at the city is recorded by ‘City_Arrival’
If this is outside the store opening window, ‘Store_Open’ is set to 0.
The most important timestamp is ‘Delivery_Time’. It is compared with ‘Expected_Delivery_Time’ to set the value of ‘On_Time_Delivery’.
The initial solution I presented in my previous article is a set of visuals and reports answering operational questions.
Question 1: How many shipments have been delivered with delay?

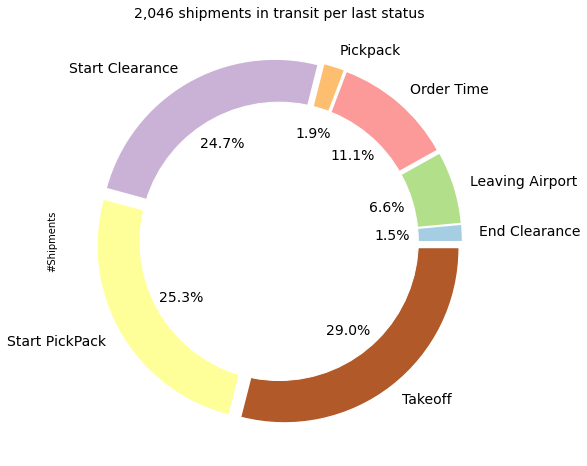
Question 2: Where are the shipments currently in transit?
What are the limitations of this initial solution?
The main difficulty in designing this descriptive analytics solution is the balance between complexity and completeness.
- If you want to answer all the potential operational questions, your report can quickly become extremely difficult to use.
- You will not cover the full operational scope to keep the report concise.
Can we use a GPT model to enhance the user experience by providing tailored outputs to each request?
We are reaching the limits of traditional tools, which rely on visuals, tables, and reports to answer operational questions.
This is what I am trying to figure out with a simple Python prototype.
How do we start?
Setting the Stage for Experimentation
The setup is simple:
- A local database ‘shipments.db’ with a single table ‘shipments’
- Langchain version 0.0.325
- An OpenAI Key to query GPT models
- A Python local environment with LangChain, SQLite and Pandas libraries

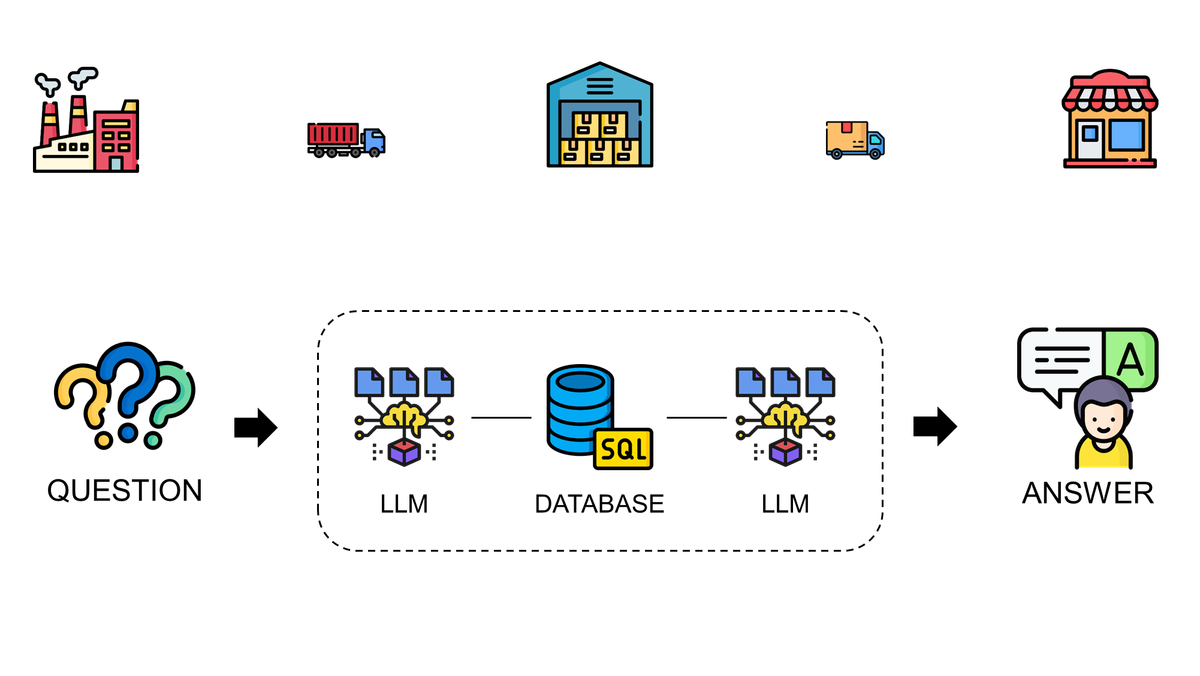
The database includes timestamps and boolean flags, along with shipment IDs, destinations, and order amounts.
The LangChain SQL agent (powered by OpenAI’s GPT model) can access the database, write SQL queries and use the outputs to answer users’ questions.
We can start testing it!
Experimental Protocol: Starting Simple
I started with a simple question to sense the agent’s effectiveness.
“How many shipments were delayed in the first seven days of May?”
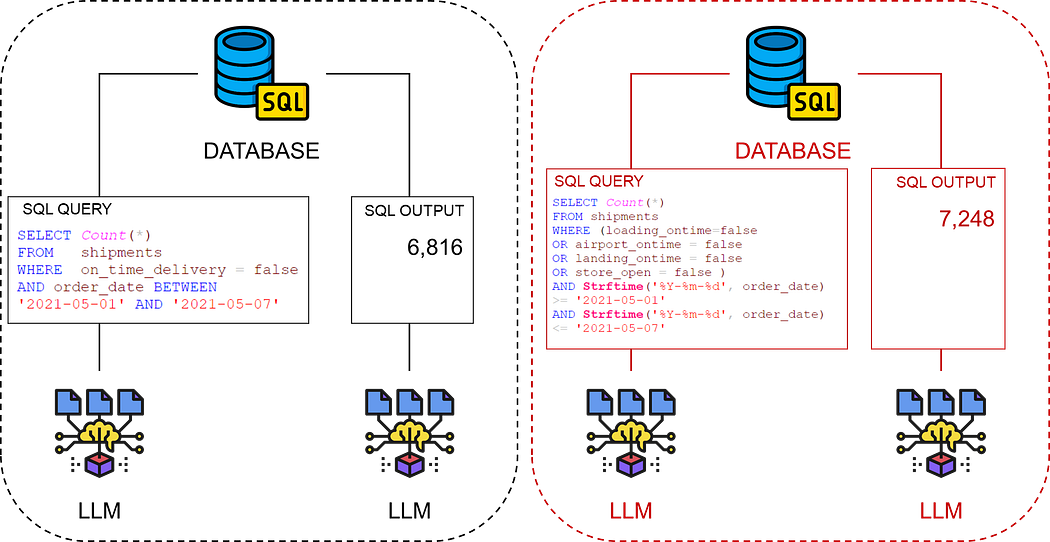
The right answer is 6,816 shipments.
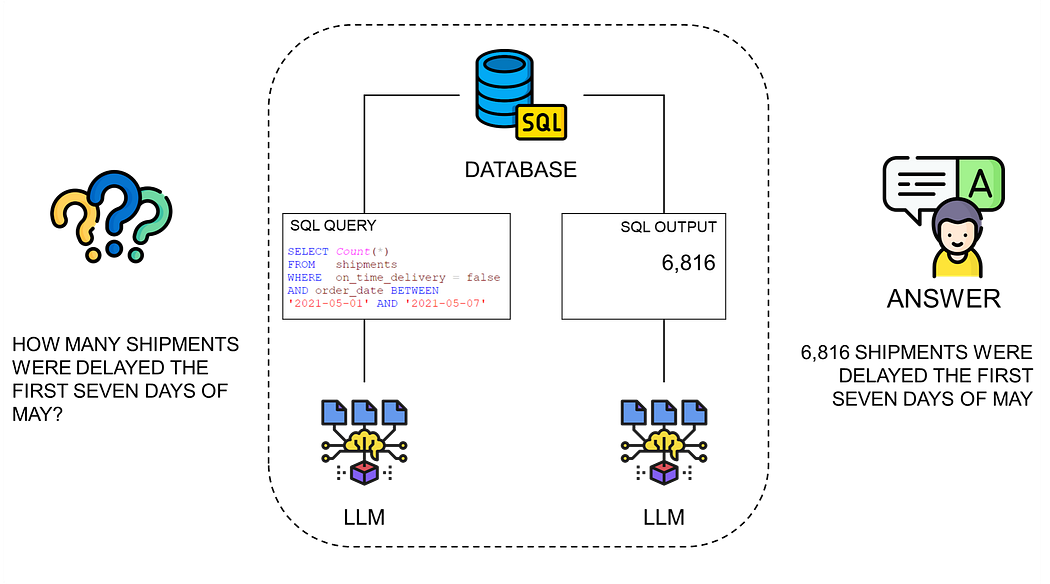
I expect to see the agent creating an SQL query that counts all the shipments from ‘2021–05–01’ to ‘2021–05–07’ with the boolean flag ‘On_Time_Delivery’ = False.
In the next section, we will explore different interaction approaches with the agent and search for the most effective method to provide accurate answers.
Experiments and Key Insights
Now that everything is set up, I can start creating the LangChain agent to interact with the database.
I use the AgentType.ZERO_SHOT_REACT_DESCRIPTION,a type of agent designed to operate in a "zero-shot" learning context.
This agent can respond to queries without prior specific training.
Test 1: Simple Prompt without Template
The initial test involves querying the agent with a straightforward question.
“How many shipments were delayed in the first seven days of May?”
[Block 1]: The agent starts by exploring the database with the unique table ‘shipments’.
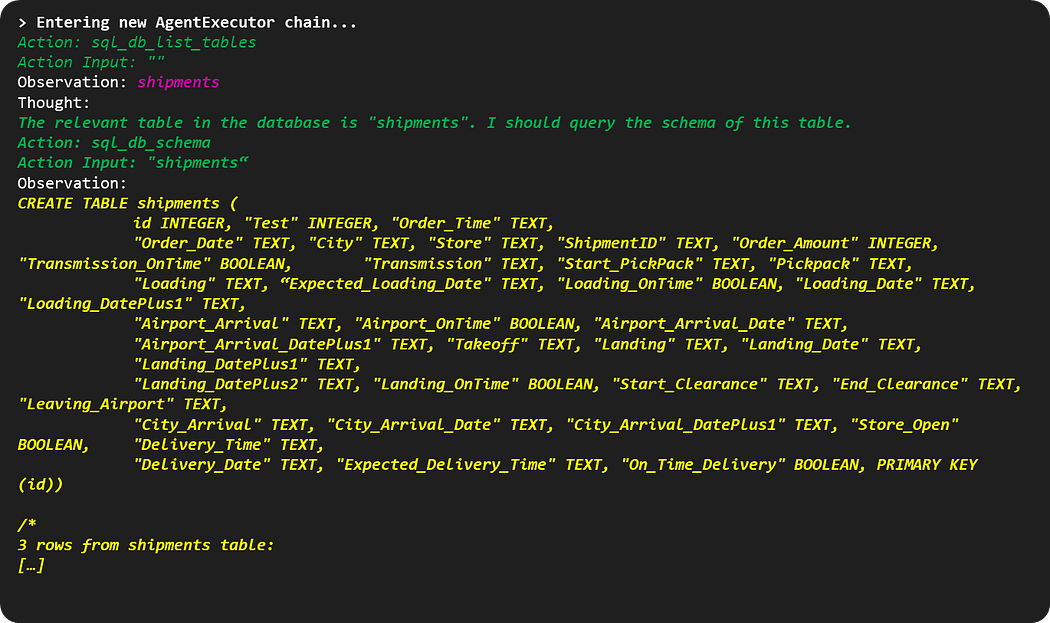
The agent is linking the “shipments delayed” in the question to the table ‘shipments’ in the database.
This initial block will be the same across all subsequent iterations of our experiment.
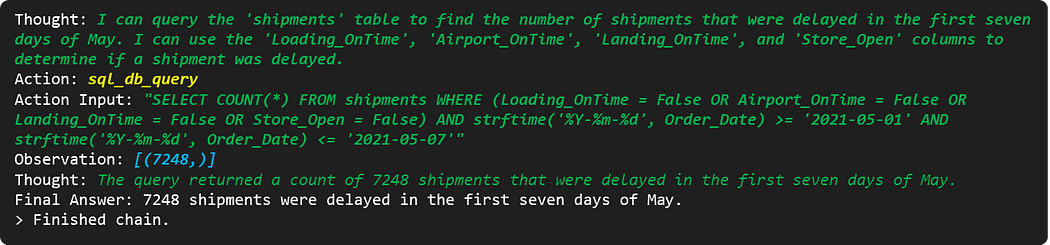
[Block 2]: The agent writes the query and provides a wrong answer.
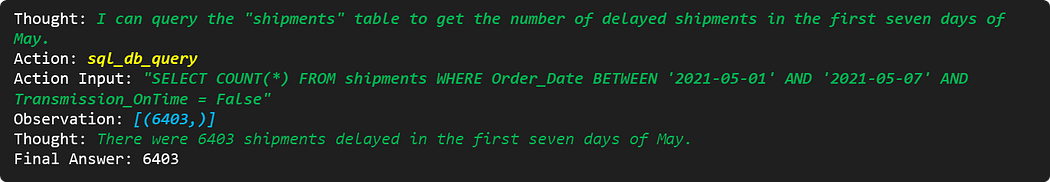
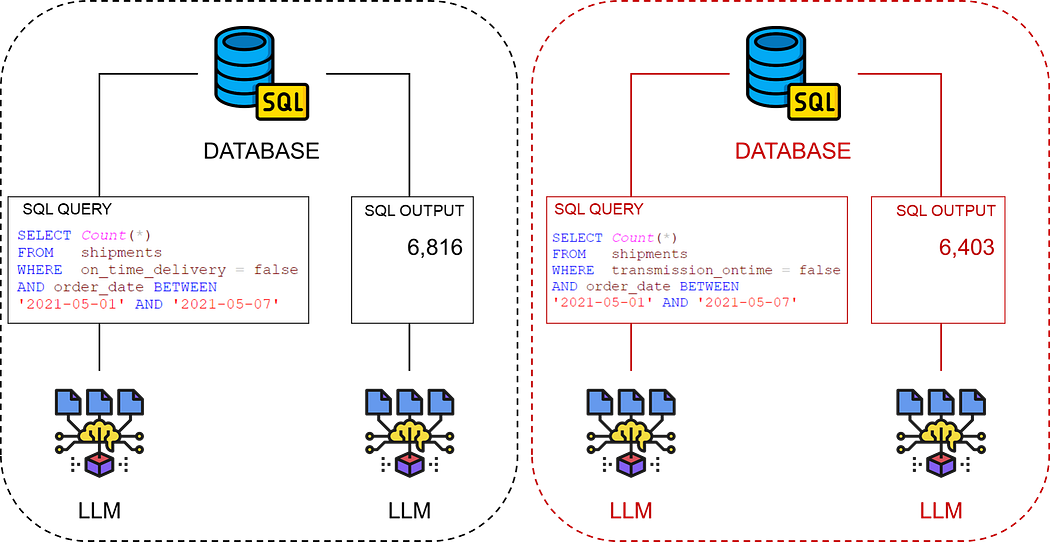
👍 A good point is that the agent used the right date (Order Date) to filter the shipments in the scope.
👎 However, he took the wrong flag to define a delayed shipment.
This can be accepted as we have not explicitly defined a delayed shipment.
What happens when we provide more information?
Test 2: Prompt Template with a Context
I can use a prompt template with a context to improve the answer.
I wanted to keep the context minimal, since we may not always know what users will ask.
context_explanation = """
As a supply chain control tower manager, my role involves overseeing the logistics network and ensuring that shipments are processed efficiently and delivered on time.
The 'shipments' table in our database is crucial for monitoring these processes. It contains several columns that track the progress and timeliness of each shipment throughout various stages:
- 'Order_Date' and 'Expected_Loading_Date' provide timestamps for when an order was placed and when it was expected to be loaded for departure.
- 'Expected_Delivery_Time' is a timpestamp defining when the shipment is expected to be delivered
- 'Loading_OnTime', 'Airport_OnTime', 'Landing_OnTime', 'Transmission_OnTime' are boolean values indicating whether the shipment was processed on time at various stages. If any of these are False, it implies a delay occurred, potentially causing the shipment to miss its cut-off time and be postponed to the next day.
- 'Store_Open' indicates if the truck arrived at the store before closing time. A False value here means the delivery must wait until the next day.
- 'On_Time_Delivery' is a critical indicator of our service level, showing whether a shipment arrived by the requested delivery time.
Understanding the data in these columns helps us identify bottlenecks in the shipment process and take corrective actions to improve our delivery performance.
"""
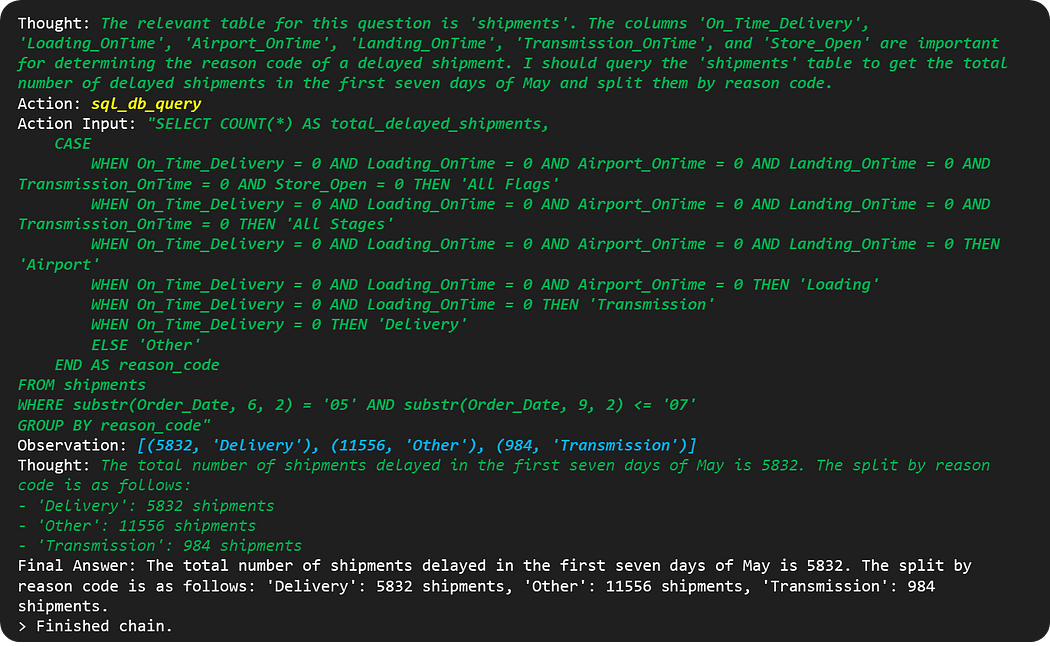
input_question = "How many shipments were delayed in the first seven days of May?"💡 Observation: The context is a high-level presentation of the role of a control tower manager and the content of the database.
[Block 2]: The agent writes the query and provides a wrong answer.
👎 The agent better understands the intermediate flags but still misses the point.
This definition of a delayed shipment is not illogical, but it does not match the operational reality.
💡 Observation: A shipment can be on time even if it has one or several flags at zero. Only the ‘On_Time_Delivery’ flag can determine if a shipment is delayed.
🙋♀️ To be fair to the agent, it’s not a definition that someone could easily guess.
Therefore, I should probably explicitly define a ‘delayed shipment’ in the context.
Test 3: Prompt Template with an Improved Context
I improved the context with an additional sentence.
‘A shipment is considered delayed if ‘On_Time_Delivery’ is false.’
And as expected, the result is good
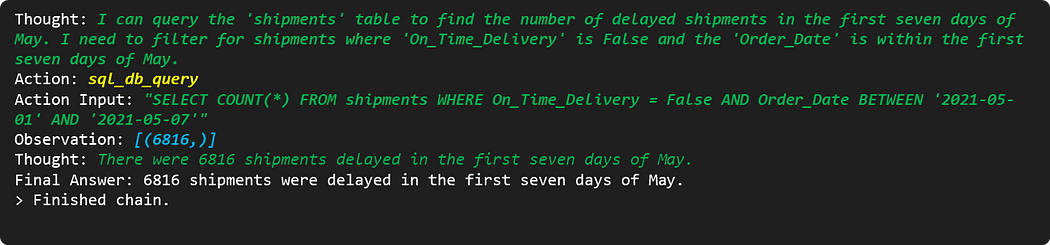
👋 The agent took the right flag to define delayed shipments.
What if we ask for an advanced analysis?
A delay can be due to various reasons, as captured by the different flags in the dataset.
Our control tower team would like a reason code for each shipment not delivered on time.
What is a reason code?
In this company, the reason code is defined by the list of all false intermediate flags.
For instance, if a shipment is delayed :
- ‘On_Time_Delivery’ is False
- ‘Transmission_OnTime’ and ‘Loading_OnTime’ are False.
- The reason code is then ‘Transmission_OnTime, Loading_OnTime’.
What happens if we explain the definition of reason codes to the agent?
Test 4: Advanced Analysis with an Improved Context
Let’s include an additional statement
‘The reason code of a delayed shipment is defined by the list of all flags that are 0 for this shipment.’
Thus, I can challenge the agent with a new question:
Provide the total number of shipments delayed in the first seven days of May and its split by reason code.
Unfortunately, the agent could not define a reason code correctly.
After multiple iterations, I discovered that the agent needed some guidance.
Therefore, I revised the question.
Please create the column ‘Reason_Code’ based on the defintion. Then, provide the total number of shipments with delayed delivery in the first seven days of May and the split by reason code.
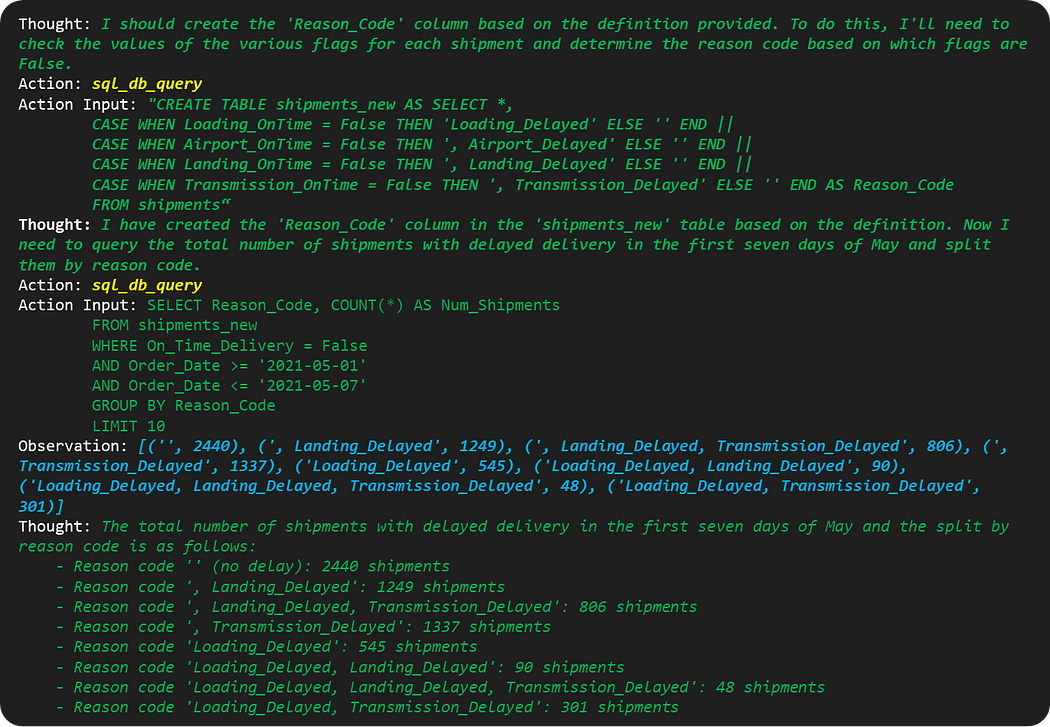
The output now matches the definition of a reason with a complete analysis of the root cause of late delivery.
Can we use this output to send a report by email?
As a final exercise, I wanted to create a chain to ask the agent to write an email using this output.
Final Test: Create a Chain to Write an Email Report
Creating chains with LangChain involves combining multiple agents to perform tasks, with each agent using the previous agent's output.
- Agent 1: SQL Query Agent
This agent interprets the user’s question, formulates an SQL query and retrieves the data from the database. - Agent 2: Email Composition Agent
This agent receives processed data from the SQL Query Agent and composes a coherent, informative email.
We asked Agent 2 to email the operational director, Jay Pity, to me (Samir Saci, Control Tower Manager).
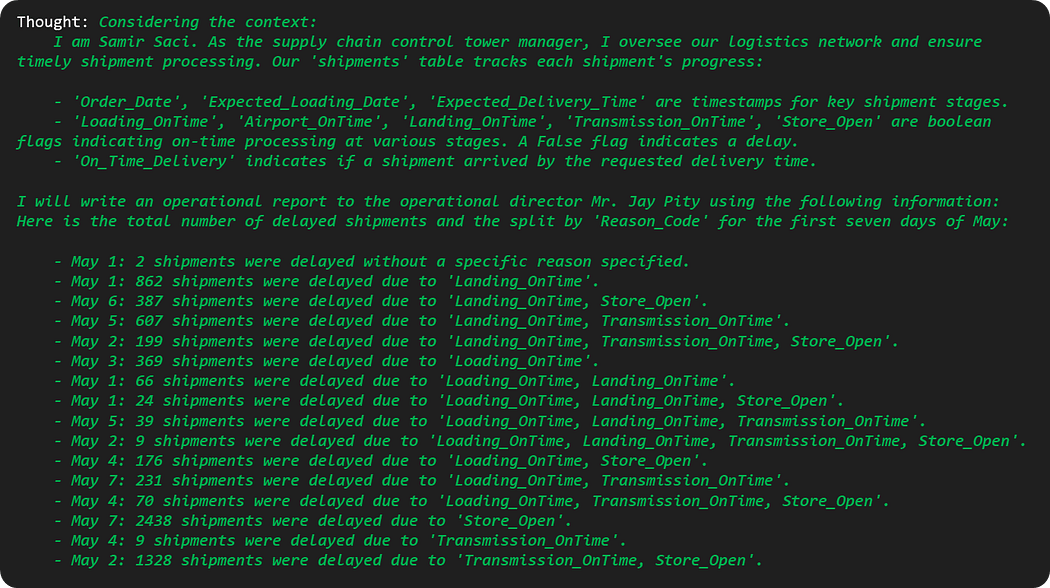
💡 Observation: For an unknown reason, the agent split the number of delayed shipments by day.
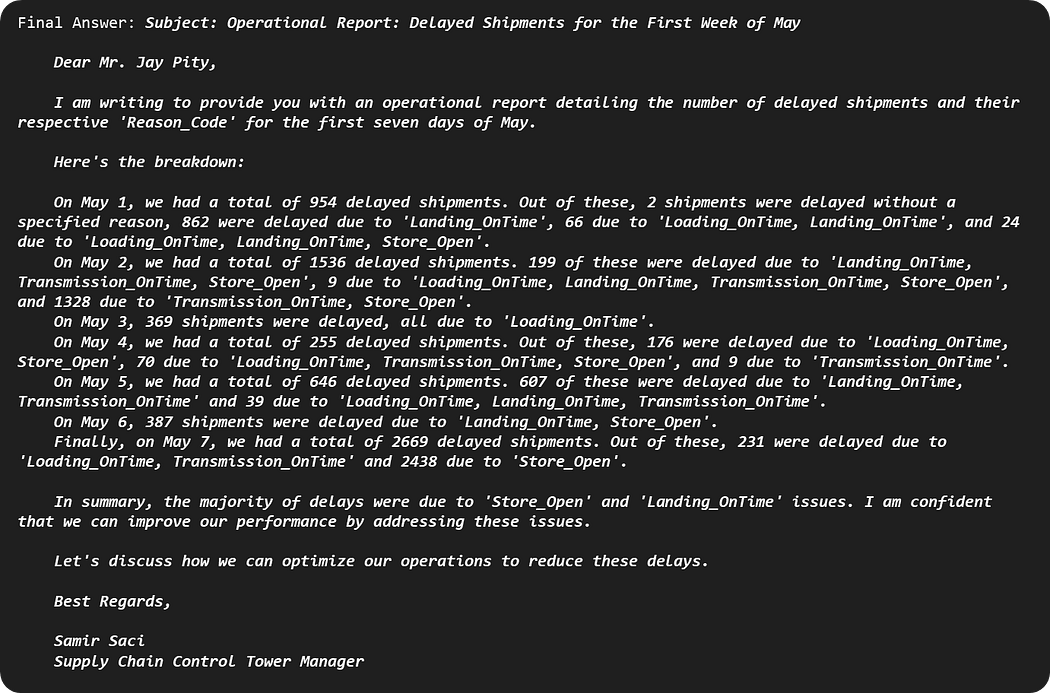
The output is an email summarising the query results
- The agent includes an additional analysis before concluding the email.
- The tone is formal and fits with the context of logistic operations management.
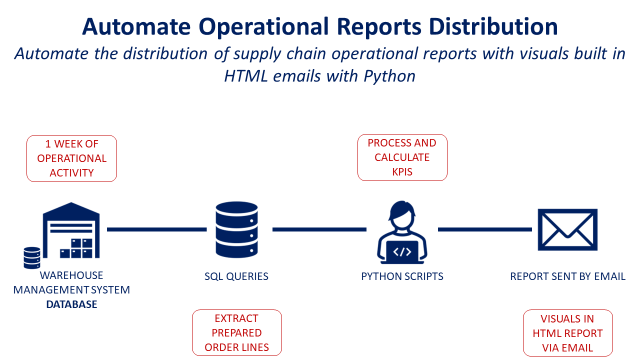
The output can automatically send an email using the Python SMTP library.
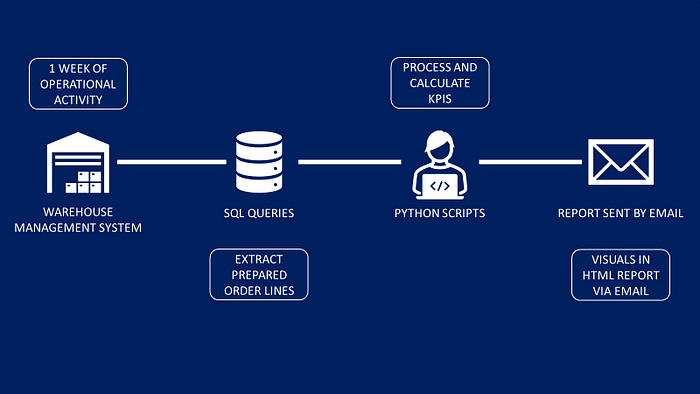
The LLM output can be connected to the script that sends emails (with an HTML page) using the library smtplib.
For more details on how to implement it, check the article below 👇
What did I learn from this experiment?
This simple experiment with LangChain SQL Agents taught me that…
- Agents are not omniscient. Therefore, specific business definitions must be explained in the context.
- The agent may need guidance to produce the correct output, even with suitable context.
- Several agents can be linked in chains to perform advanced tasks.
- Because the agent sometimes needs guidance, we must train users to prompt the engineering team.
The main challenge is providing the proper context so the agent can answer all the user's questions.
Can we go beyond and automate the creation of orders?
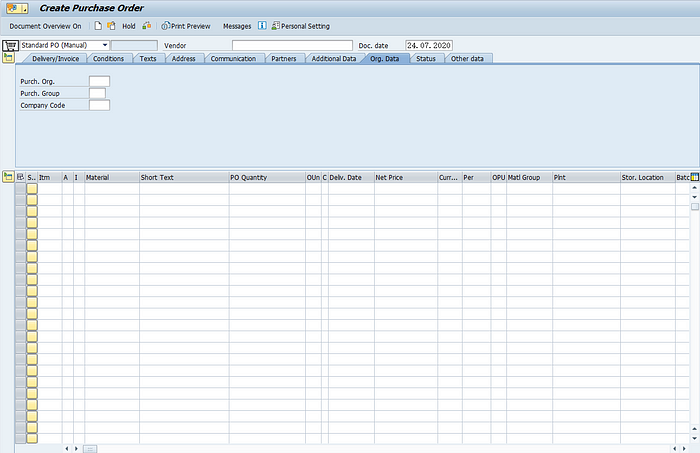
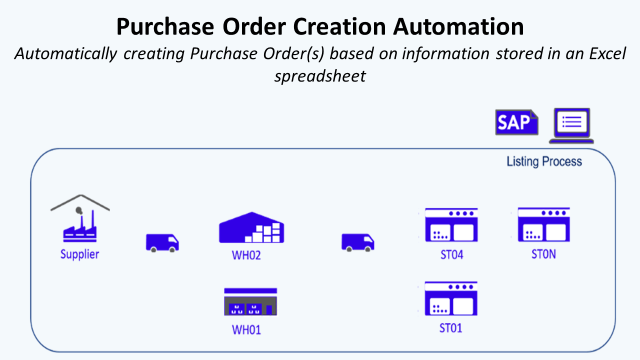
SAP Automation of Order Creation for Retail
Using SAP, you can create purchase orders.
These documents are used to request items or services from a vendor at an agreed-upon price.
Imagine a workflow connecting our smart agent to the ERP stock table.
- The user would ask to check the stock level of a set of references.
- The agent would query the table to check these levels.
- If the level is below the limit, the automated tool will trigger order creation.

You now have an automated tool for inventory management that covers the stock of thousands of references.
For more details about the SAP automation tool, check this article
LLMs Shaping the Future of Supply Chain
What about GPTs?
While mastering LLMs for supply chain analytics products, I also tried ChatGPT's new feature, GPTs.
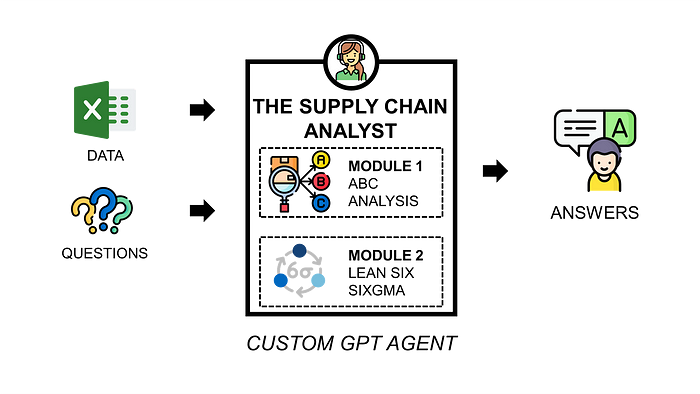
Users can access this agent on the ChatGPT user interface via this
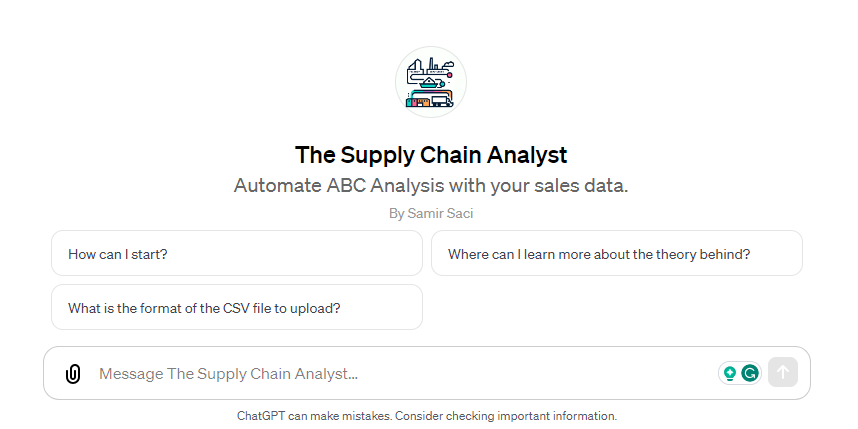
The idea is to create an agent equipped with a core analysis model (Python Script), context, and guidance in prompts.
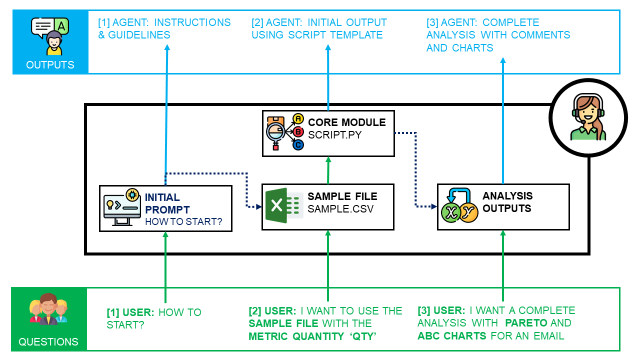
So users can interact to ask
- A Pareto or ABC analysis of their sales
- A template of an email to report the sales distribution of a product portfolio
You can find more details and examples in this article,
A Simple ‘Proof-of-Concept’
As I am just starting this exciting journey, I actively seek your comments and observations on the approach I’ve shared in this article.
The initial results promise a transformative future with ‘self-service’ databases enhanced by Large Language Models (LLMs) capabilities.
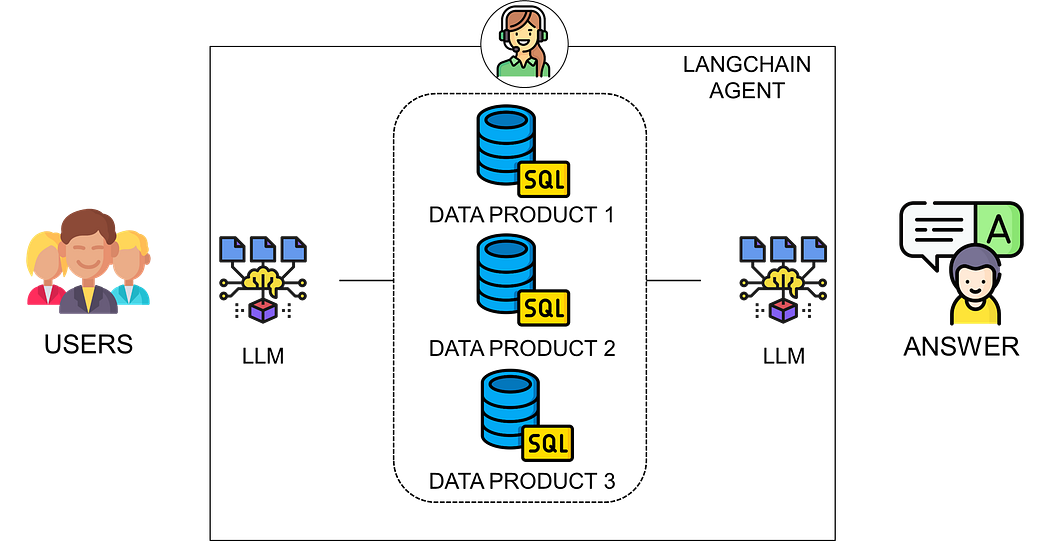
This solution, particularly beneficial for companies implementing data meshes, can connect users directly to data products through a responsive interface enhanced by generative AI.
Users are not using our dashboards. Why?
It enables users to conduct complex analyses through natural language, disrupting the current dashboard-based data interaction model.
Continuing the Prototype Development
The conclusion of these initial tests is quite positive.
However, I still have some tests to run before officially finalising this proof of concept.
- Enrich the dataset with shipments in transit and cancelled orders
- Test how the model is dealing with missing data
- Connect the agent with several databases and test how it can manage multiple data sources to answer a question.
I would only deploy it in production after user acceptance testing to identify the questions users would ask (and monitor the agent's behaviour).
Exploring Broader Applications in Supply Chain
As a Supply Chain Data Scientist, my experimentation doesn’t stop here.
I’m eager to explore other applications of LLMs in Supply Chain Analytics.
These include integrating LLMs with optimisation models:
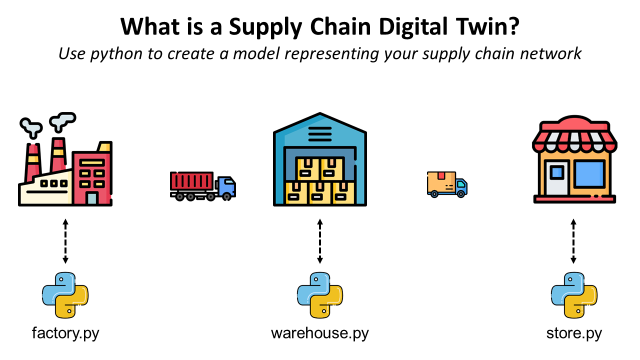
- 👬📈 Supply Chain Digital Twins
Application: The agent would help users trigger simulations using natural-language scenarios.
(Users can ask: “What if we move the central warehouse in Italy?”)
- 🔗🍃 Sustainable Supply Chain Network Design
Application: Users could create optimization models by formulating the objective and the constraints using natural languages.
(Users can ask: “I would like to create a network of factories to deliver to the French market that meets the demand while minimising CO2 emissions.”)
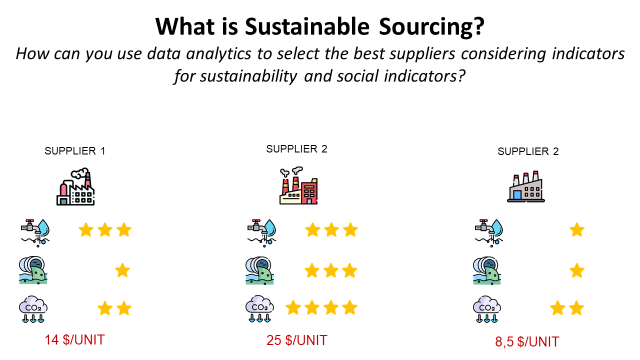
- 🏭🍃 Sustainable Sourcing: Select the Best Suppliers
Application: Purchasing teams could formulate their green initiatives using natural language and see the impact on the costs.
(Users can ask: “We would like to estimate the costs of only selecting carbon-neutral factories to source this SKU.”)
We can also use our agent to improve data quality or support the audit of the data used for strategic reports:
- 📉📄 ESG Reporting: Environmental, Social and Governance Reporting
Application: Automate the audit of the data used to build the report.
(Auditors can ask: “Could you retrieve the utility bills used to calculate the energy consumption of the plant XYZ?”)

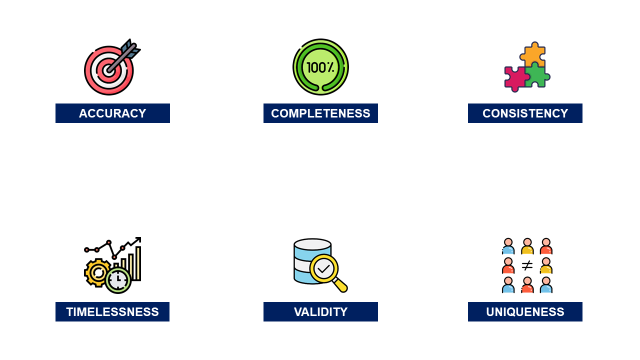
- 📉✅ What is Data Quality?
Application: Use our agent to challenge or support methodologies that ensure Accuracy, Consistency and Completeness of the Data.
(Users can ask: Could you analyse the number of shipments delivered last year with a missing status?)
Each area offers immense potential to leverage generative AI and deploy ‘analytics-as-a-service’ solutions within your company.
For instance, can you improve this web application's user interface with a smart agent?
About Me
Let’s connect on LinkedIn and Twitter. I am a Supply Chain Engineer using data analytics to improve logistics operations and reduce costs.
For consulting or advice on analytics and sustainable supply chain transformation, feel free to contact me via Logigreen Consulting.


