Supply Chain Process Design using the Queueing Theory
Apply several principles of the Queueing Theory with Python to design a parcel packing process for an e-commerce fulfilment centre

Supply Chain is a network of processes and stock locations designed to deliver goods and services to customers.
This network typically supports your company's business strategy.
The objectives can be diverse, such as delivering the best quality products, the lowest cost or the most customised service or product in the market.
As a Supply Chain Engineer, your objective is to design the most efficient processes to ensure a good service level for your customers and profitability.
This article will apply principles from the Queueing Theory with Python to design a process for parcel packing in an E-Commerce Fulfilment Centre.
💌 New articles straight to your inbox for free: Newsletter
I. Problem Statement
What is the most efficient solution between single and multiple-line solutions?
Scenario
You got the approval from your management for investing in a second packing station and you're wondering how should you design the layout.
II. Optimal Solution using Queuing Theory
1. Introduction to Process Analysis
2. The Little’s Law
3. Introduction to the Queuing Theory
4. How can we estimate this waiting time?
5. Queueing Theory to estimate tq
III. Build a Simulation Model with Python
IV. Conclusion
If you prefer watching, you can have a look at this short explainer video
Problem Statement
Scenario
You are the Outbound Manager of a multinational clothing retail company known for its fast-fashion clothing for men, women, teenagers, and children.
A major problem you’re facing is outbound productivity.
After picking, orders are waiting for too long to be shipped.
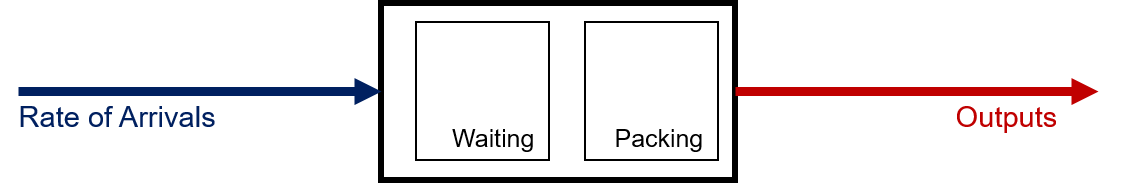
Based on on-site observations and productivity analysis, you understood that the packing process was the bottleneck.
- Warehouse Pickers bring the parcels on a trolley and put them on the conveyor
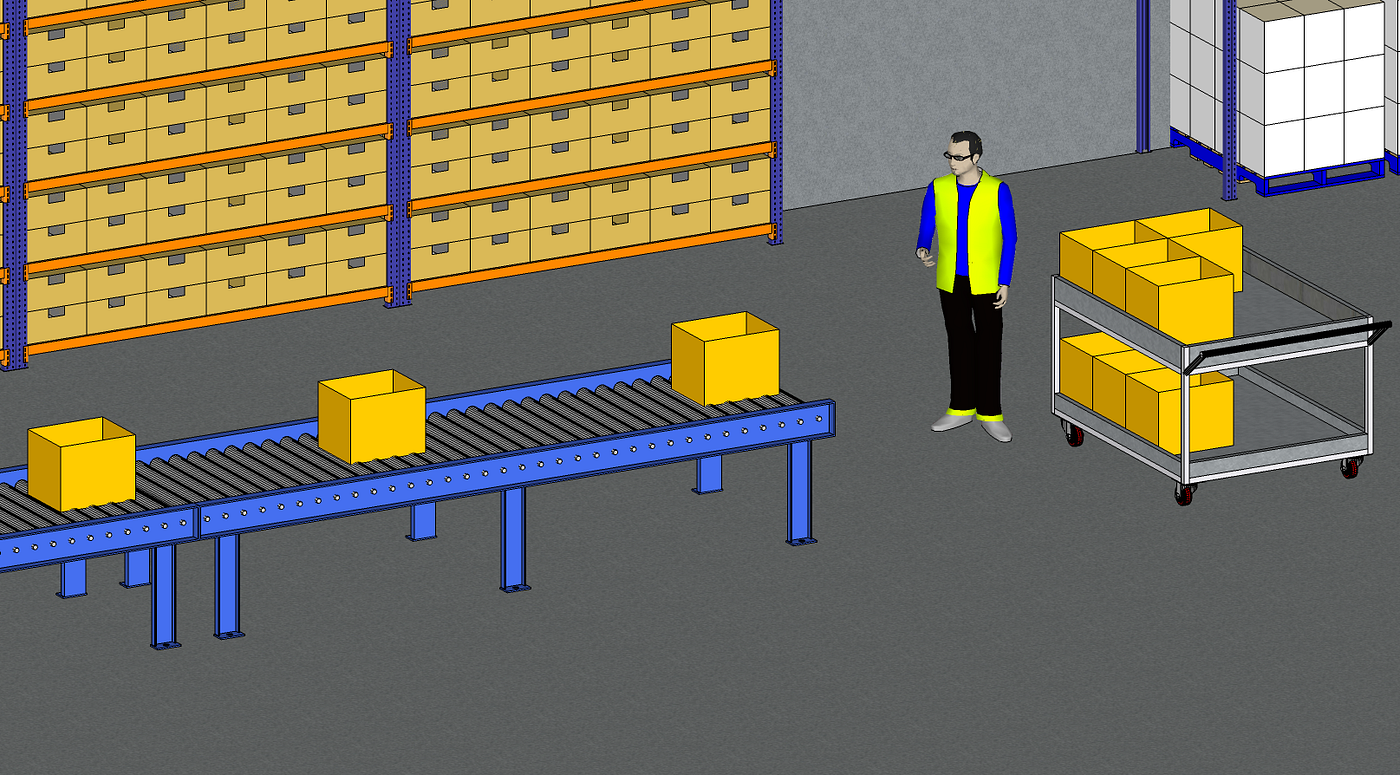
2. Packing Operators
Take the parcels from the conveyor and perform a quantity check and packing (put filling material, close the box)
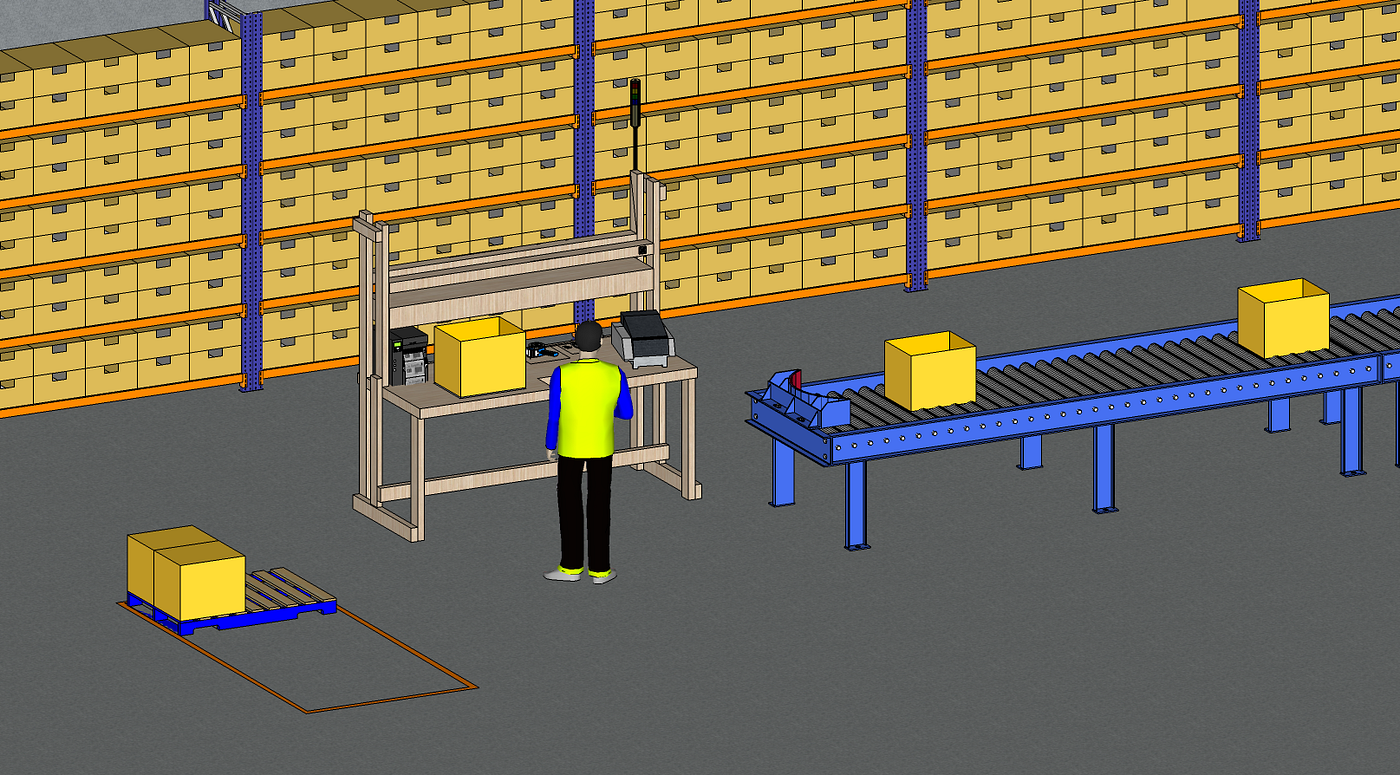
You got the approval from your management for investing in a second packing station and you’re wondering how should you design the layout.
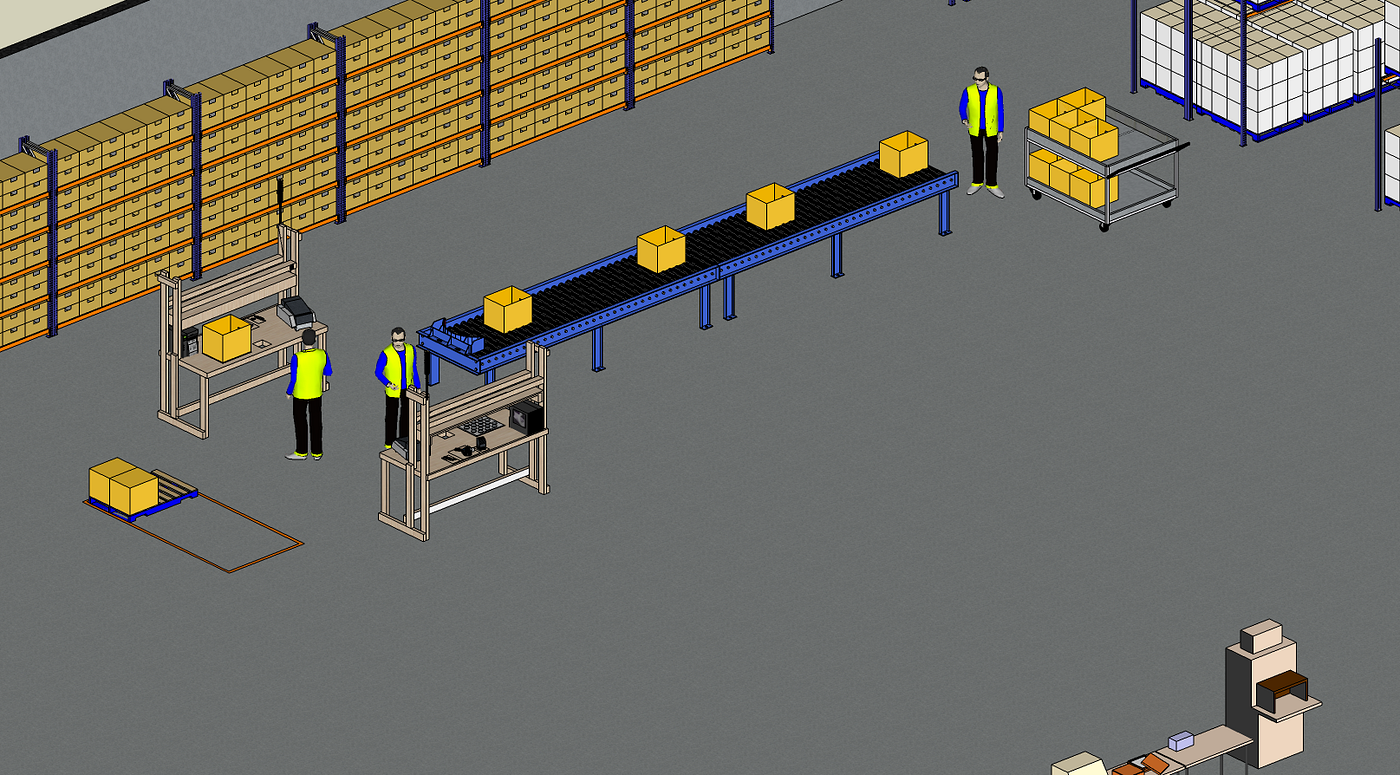
Solution 1: keep a single line with two parallel stations
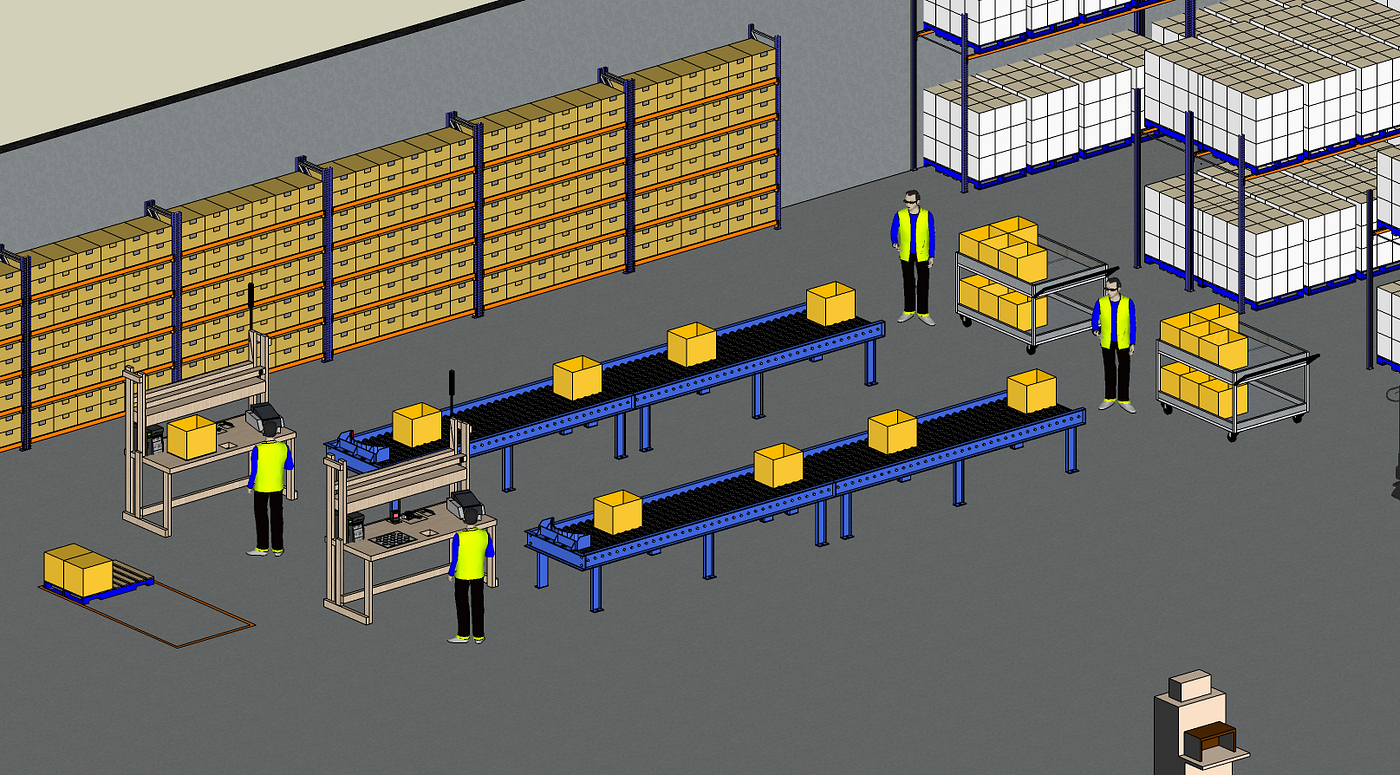
Solution 2: add a second line with a dedicated station
What is the most efficient (Packing Productivity) solution?
Optimal Solution using Queuing Theory
Queueing theory is the study of waiting times using advanced mathematical concepts.
If you want to learn more about it, I strongly recommend Supply Chain Science, written by Wallace J. Hopp.
Introduction to Process Analysis
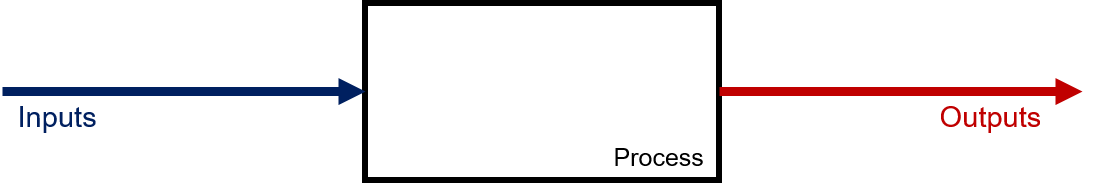
In this article, we will define a process by a succession of actions that converts inputs to outputs.
To simplify the comprehension, let’s introduce some notations:
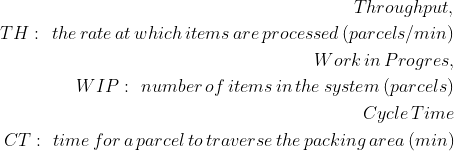
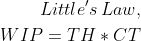
The Little’s Law
After a long time, when your system gets stable, you can use this law to calculate the average number of items in the system (WIP)
Introduction to the Queuing Theory
The cause of the productivity issues during this process is the time that needs to be spent waiting for a parcel in the conveyor before being packed.
Your operator picking productivity is quite stable.
However, you may face issues that will slow down the process:
- Picking Error: for instance, the picker has put the wrong quantity of items
- Damages: some items do not pass the quality final check because of damages
In the initial configuration, these events increase the waiting of the parcels in the WIP and impact the overall average CT.
How can we estimate this waiting time?
Let’s introduce some notations:
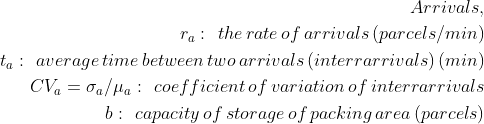
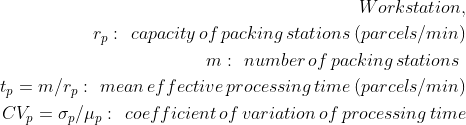
The main indicator that we want to improve is the average cycle time, which can be defined by:
with
tq: waiting time in the queue (min)
tp: effective process time
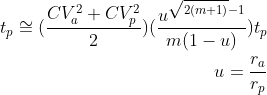
Queueing Theory to estimate tq
Using Queueing Theory, we can approximate the waiting time with,
Build a Simulation Model with Python
Parameters
ra = 6 parcels/min
ta = 0.17 min/parcel
CVa: coefficient of variation of ta
Processing,
rp = 3 parcels/min
tp = 0.33 min/parcel
CVb: coefficient of variation of tp
Waiting Time Formula for the Two Solutions
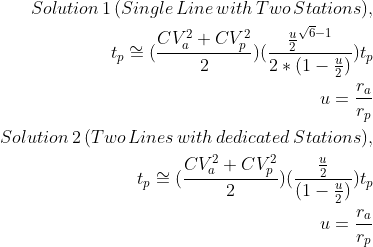
Note
We have u -> u/2 because the input flow is splitted through the two packing stations.
Simulation
Scenario
- Deterministic Distribution of Arrivals: CVa = 0
- Stochastic Distribution of Processing Time: CVp in [0, 2]
This scenario can be based on batch packing: your picking operators prepare orders in advance and send parcels in a continuous flow at a fixed interval.
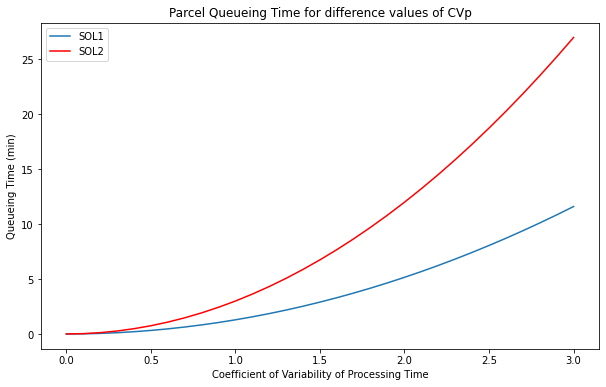
Comments
- We have no difference for a purely deterministic scenario (CVp = CVa = 0) as the queuing time is zero for both solutions.
- When we bring variability in the processing time (number of items per parcel to check, picking errors, quality issues we see that solution 1 outperforms solution 2.
Interpretation of the results
A parcel with a quality issue will paralyse a full line if you take solution 2 (50% of the input flow).
Therefore, this solution is suboptimal if your processing time is highly variable.
With Solution 1, we can ensure that the first parcels "In" will be more or less the first parcels "Out", while we can’t predict that result with Solution 2 (imagine that one of your lines is facing a huge delay because of one parcel)
Not convinced? Implement it yourself!
Conclusion
Based on these simulation results, you can estimate the impact on the average cycle time (by adding the processing time to the queueing) and motivate your choices in the design.
Fortunately, the most efficient solution is also the cheapest, as you do not need to invest in a new conveyor.
About Me
Let’s connect on Linkedin and Twitter. I am a Supply Chain Engineer who is using data analytics to improve logistics operations and reduce costs.
If you’re looking for tailored consulting solutions to optimise your supply chain and meet sustainability goals, feel free to contact me.