🌲 Sustainability
The demand for transparency in sustainable development from investors and customers has grown over the years.
Your organization is probably developing a sustainability roadmap with initiatives to monitor and reduce its operations' environmental impact.
How can you use data analytics to support the green transformation of your company your company?
In this section, you can find articles about methodologies and tools using Data Analytics to measure, monitor and reduce the environmental impact of your Supply Chain.
♻️ Sustainable Initiatives
How can you reduce CO2 emissions and optimize resource usage by implementing a data-driven approach to Supply Chain Optimization?

Supply Chain Operations Optimization
- 🧑💼 Sustainable Business Strategy with Data Analytics
- 🗑️ Sustainable Logistics - Reduce Warehouse Consumables
- 🚛 Case Study for Green Inventory Management
- 📈 Data Analytics for Supply Chain Sustainability
Circular Economy
- ♻️ What is a Circular Economy?
- 👗 How Sustainable is Your Circular Economy?
- 🏬 What are the Challenges of Circular Economy for Fashion Retail?
- ⭕ How Will Data Science Accelerate the Circular Economy?
Sustainable Sourcing
I have also developed a web application, have a look 👇
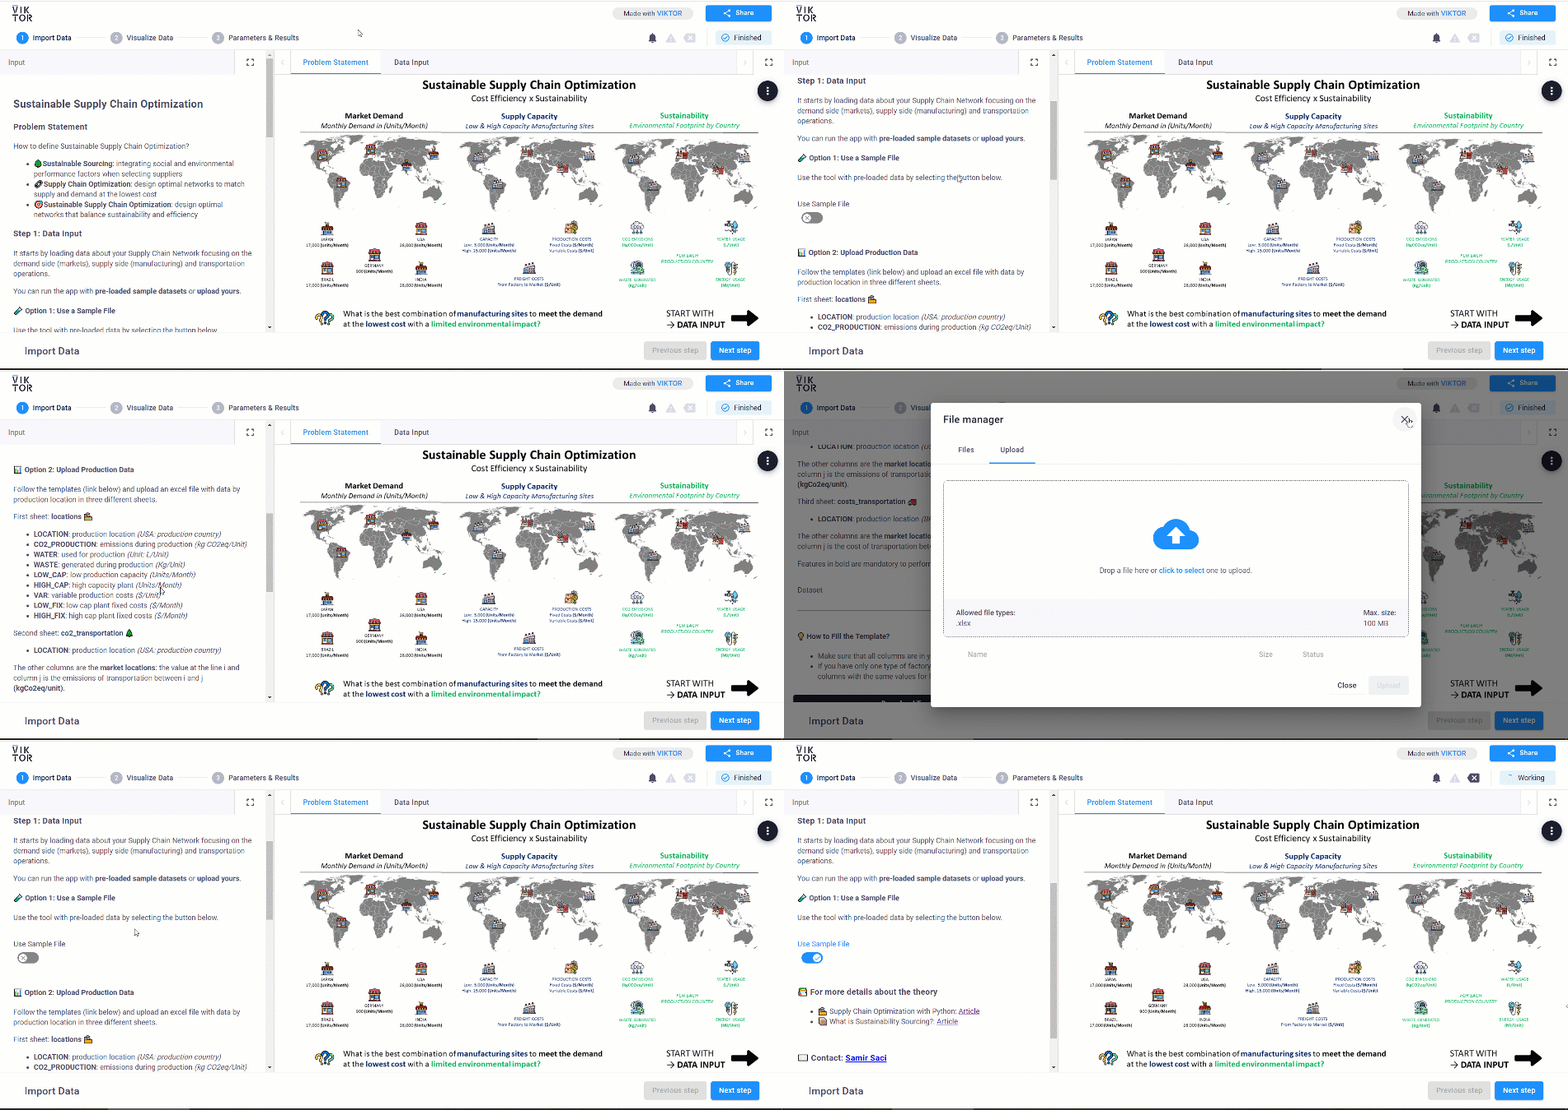
🏭 Sustainable Supply Chain Optimization App
Using this web application, you can simulate several scenarios to estimate the impacts of implementing sustainability constraints on your supply chain network efficiency.

- Where should you open manufacturing facilities if you want to minimize the amount of CO2 emissions?
- What would be the overall cost impact if you seek to minimize the straightforwardwater used to produce your goods?
- What is the perfect combination of production facilities to limit the amount of waste generated?

It is straightforward to use.
You can get your network design after following these four steps.
- Use the pre-loaded sample dataset or upload your data using the template.
- Visualize all the parameters that will impact your network design (demand, supply, costs and environmental impacts)
- Choose the objective function: minimize costs, CO2 emissions or water usage
- Visualize the results, including the cost structure (fixed/variable), the goods flow from plants to markets and the environmental impacts.
Try it ➔

📊 Reporting and Monitoring
Use data analytics to collect data from multiple sources to measure the environmental impacts of your end-to-end Supply Chain operations.

