What is EDI? Electronic Data Interchange
Explore how Electronic Data Interchange (EDI) facilitates modern supply chain management.
Electronic Data Interchange (EDI) is a standardized method of automatically transferring data between computer systems.
As the supply chain becomes more digital, effective data exchange has become a must-have for any major company.

In the complex network of suppliers and distributors, efficient data communication is critical.
As analytics experts, how can we use EDI technology to support the digital transformation of organizations?
They ensure the smooth flow of essential transactional data, such as purchase orders, invoices, shipping notices, and more.

In this article, we will uncover the crucial role of Electronic Data Interchange (EDI) in driving supply chain operations and how it can empower data analytics.
We will illustrate how EDI messages translate into action in warehouse operations using Python scripts.
I. EDI for Supply Chain Management
1. A must-have for any large business
2. More than 60 years of history
3. EDI Standards
4. Supply Chain Processes that use EDIs
II. Data Interchange & Operational Management
1. Warehouse Operations Simulation Model
2. Build a simulation model with Python
III. Why is Business Intelligence Significant?
1. What is the environmental impact of our operations?
2. Become a data-driven green organization
IV. What's Next?
1. EDI for ESG Reporting and GreenWashing
2. Conclusion
What is EDI for Supply Chain Management?
This is a must-have for any large business.
Electronic Data Interchange (EDI) was created to facilitate efficient, reliable, and secure data exchange.
After several decades, it has deeply imposed itself as a must-have for any large modern business.
It facilitates the automatic transmission of business documents in a standardized format.
This allows diverse systems to communicate using a common language.
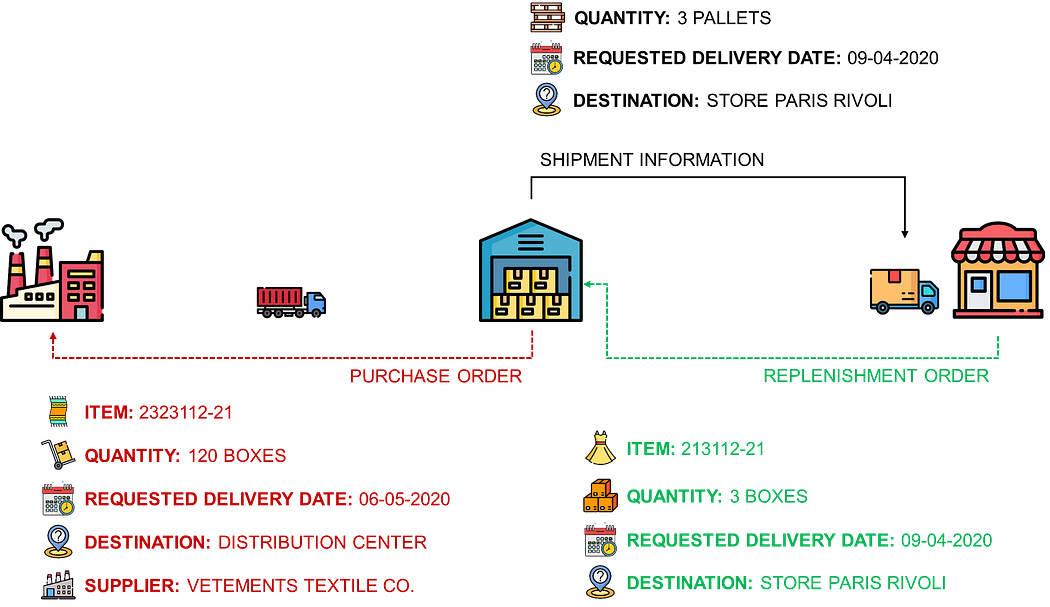
- A company wants to send a supplier a purchase order with item(s) information, quantity and expected delivery date.
- A warehouse wants to inform a carrier that a pallet is ready to be picked
- A store sends a replenishment order to a central distribution centre
More than 60 years of history
Developed in the late 1960s, EDI initially served to transmit shipping and transportation documents.

Over the years, EDI expanded its capabilities to cover various industries, with more than 150k businesses focusing on supply chain management.
Considering the massive daily transactions, it is challenging to imagine international supply chains operating without EDI.
What are the EDI Standards?
EDI operates according to established standards used across industries and geographic locations.

However, there are two predominant standards
- ANSI X12: primarily used in North America
- EDIFACT: created by the UN and used internationally
These standards define the string format and the information contained in EDI messages.
They are ensuring uniformity in data interpretation across various systems.
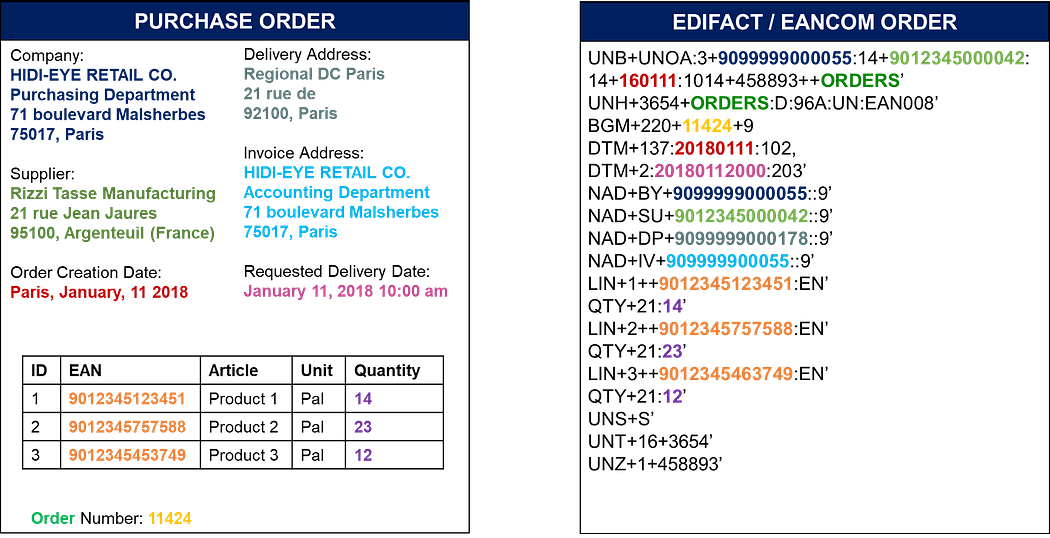
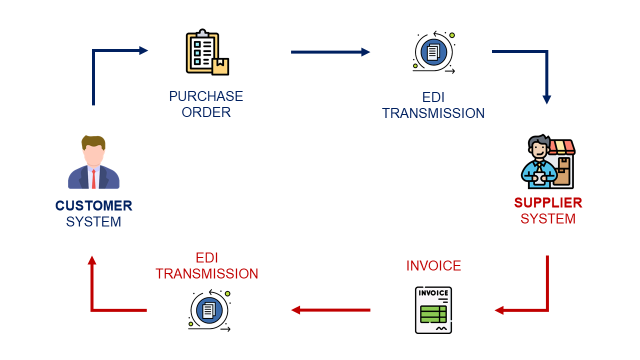
In the example above, a purchase order is translated into an EDI message for transmission.
- An order is created by the purchasing team and received by the supplier
- Order information includes customer, supplier, delivery address and date, invoice address and detailed information about ordered items
- Invoicing, delivery and company information are mapped using IDs (Company ID, Location ID, …)
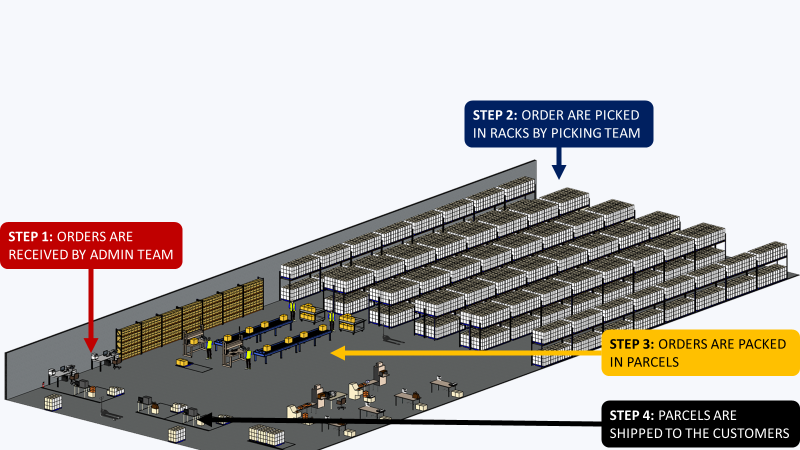
What are the Supply Chain Processes that use EDIs?
With the complexification of supply chain operations, EDI messages form the backbone of communication for critical events like:
- Inbound shipment arriving at a warehouse
- A pallet is being put away
- A picking order that is being executed
- An outbound shipment that is cancelled
EDI messages keep the wheels of logistic operations turning.
To illustrate this idea, we will use Python to simulate creating and transmitting EDI messages for warehouse operational management.
Data Interchange & Operational Management
Design of a Warehouse Operations Simulation Model
In our Python script, we will replicate several warehousing processes from the angle of EDI message exchange.
- Inbound shipment messages containing details like SKU and quantity
- Putaway confirmations with SKUs and putaway locations
These messages enable synchronisation of the ERP and Warehouse Management systems (WMS), drive efficiency and reduce errors.
- Message 1: informing the warehouse teams that a shipment is coming for inbound via the WMS (ERP -> WMS)
- Message 2: warehouse teams inform the distribution planning team that the pallet has been put in stock and is ready to be ordered (WMS -> ERP)
Let’s build our own EDI message simulation tool with Python.
Build a simulation model with Python
Let’s simulate these message exchanges using the EDI norm ANSI X12
- Inbound: goods are received at the warehouse
An EDI message (Warehouse Shipping Order — 940) notifies the warehouse of an incoming shipment and its details. - Putaway: after receiving, goods are stored at a specific location
A confirmation EDI message (Warehouse Stock Transfer Receipt Advice — 944) is returned to the ERP to confirm the putaway. - Picking: for an order, items are picked from storage locations
This EDI message (Warehouse Shipping Order — 940) can instruct the warehouse on which items to pick. - Outbound: shipping to the customer
An EDI message (Warehouse Shipping Advice — 945) is sent to the ERP to confirm that the goods have been shipped.
Here is the simplified version of the Python script,
# Note: this script has been simplified for educational purposes.
class EDIMessage:
def __init__(self, message_id):
self.message_id = message_id
self.content = ""
def add_segment(self, segment):
self.content += segment + "\n"
def get_message(self):
return f"ST*{self.message_id}*1\n{self.content}SE*2*1"
class Warehouse:
def __init__(self):
self.inventory = {}
def receive_inbound(self, message):
lines = message.content.split("\n")
for line in lines:
if line.startswith("N1"):
_, _, sku, quantity, unit = line.split("*")
self.inventory[sku] = self.inventory.get(sku, 0) + int(quantity)
print("Received Inbound Shipment:\n", message.content)
def process_putaway(self, sku):
message = EDIMessage("944")
if sku in self.inventory:
message.add_segment(f"N1*ST*{sku}*{self.inventory[sku]}*units")
print("Putaway Confirmation:\n", message.get_message())
return message
else:
print("SKU not found in inventory.")
def process_picking(self, message):
lines = message.content.split("\n")
for line in lines:
if line.startswith("N1"):
_, _, sku, quantity, unit = line.split("*")
if self.inventory[sku] >= int(quantity):
self.inventory[sku] -= int(quantity)
else:
print(f"Insufficient quantity for SKU {sku}")
print("Processed Picking Order:\n", message.content)
def process_outbound(self, picking_message):
message = EDIMessage("945")
lines = picking_message.content.split("\n")
for line in lines:
if line.startswith("N1"):
_, _, sku, quantity, unit = line.split("*")
message.add_segment(f"N1*ST*{sku}*{quantity}*boxes")
print("Outbound Shipment Confirmation:\n", message.get_message())
return message
Initiate the model and create your inbound order
- Two different SKUs received in cartons
- {Qty 1: 50 boxes, Qty 2: 40 boxes}
warehouse = Warehouse()
# Inbound Process
inbound_message = EDIMessage("940")
inbound_message.add_segment("N1*ST*SKU123*50*boxes")
inbound_message.add_segment("N1*ST*SKU124*40*boxes")
warehouse.receive_inbound(inbound_message)
print("Inventory of {}: {} boxes".format("SKU123",warehouse.inventory["SKU123"]))
print("Inventory of {}: {:,} boxes".format("SKU124",warehouse.inventory["SKU124"]))
And the output looks like this,
N1*ST*SKU123*50*boxes
N1*ST*SKU124*40*boxes
Inventory of SKU123: 50 boxes
Inventory of SKU124: 40 boxes
- The two messages that have been transmitted
- Inventories of received items have been updated with the received quantity
Putaway confirmation
warehouse.process_putaway("SKU123")
This message sends a putaway confirmation for “SKU123”
ST*944*1
N1*ST*SKU123*50*units
SE*2*1
Picking orders and outbound shipments
- The two SKUs are picked with quantities below their inventory level
picking_message = EDIMessage("940")
picking_message.add_segment("N1*ST*SKU123*10*boxes")
picking_message.add_segment("N1*ST*SKU124*5*boxes")
warehouse.process_picking(picking_message)
print("Inventory of {}: {} boxes".format("SKU123",warehouse.inventory["SKU123"]))
print("Inventory of {}: {:,} boxes".format("SKU124",warehouse.inventory["SKU124"]))
# Outbound Process (Sending out goods)
warehouse.process_outbound()
Output,
N1*ST*SKU124*5*boxes
Inventory of SKU123: 40 boxes
Inventory of SKU124: 35 boxes
ST*945*1
N1*ST*SKU123*10*boxes
N1*ST*SKU124*5*boxes
SE*2*1
- 2 picking orders with 10 and 5 boxes for “SKU123” and “SKU124”
- The inventory has been updated
- The outbound orders are taking the quantities picked
How can we ensure smooth transmission?
Error Detection & Handling
We did not introduce this model solely for coding.
The idea is to understand how to create various checks to handle errors when writing or reading messages.
EDI is not exempt from data quality issues like
- Missing data, incorrect data format, invalid codes, …
- Logical inconsistencies are causing significant operational disruptions
Therefore, robust data checks and validations are crucial to ensuring the accuracy and reliability of Electronic Data Interchange.
Example of error handling for receiving orders
lines = message.content.split("\n")
for line in lines:
if line.startswith("N1"):
try:
_, _, sku, quantity, unit = line.split("*")
# SKU or quantity is missing
if not sku or not quantity:
print("Error: SKU or quantity missing.")
return
# Quantity is an integer
quantity = int(quantity)
# Negative or zero quantities
if quantity <= 0:
print("Error: Quantity must be positive.")
return
self.inventory[sku] = self.inventory.get(sku, 0) + quantity
except ValueError:
print("Error: Incorrect data format.")
return
print("Received Inbound Shipment:\n", message.content)
This piece of code is:
- Checking if quantities are missing or not in the integer format
- Verify that all quantities are positive
- Raise an error if needed
What’s next?
With Python, you can support your infrastructure team in automating testing to develop new EDI messages.
What is the Power of EDI for Data Analytics?
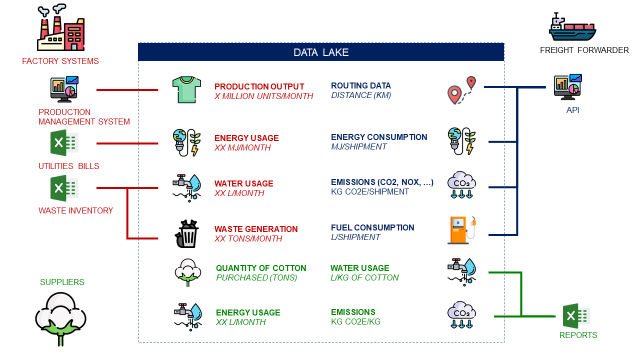
By connecting diverse computer systems, EDI supports daily operations and serves as a veritable goldmine for data analytics.
Each EDI transaction carries valuable information,
- Time stamps, locations and reason codes that provide traceability of your shipments and measure process(es) performance
- Quantity, Pricing, and Item information that can be used to model material, financial and information flows
Generate transactional data to monitor and improve a supply chain network.
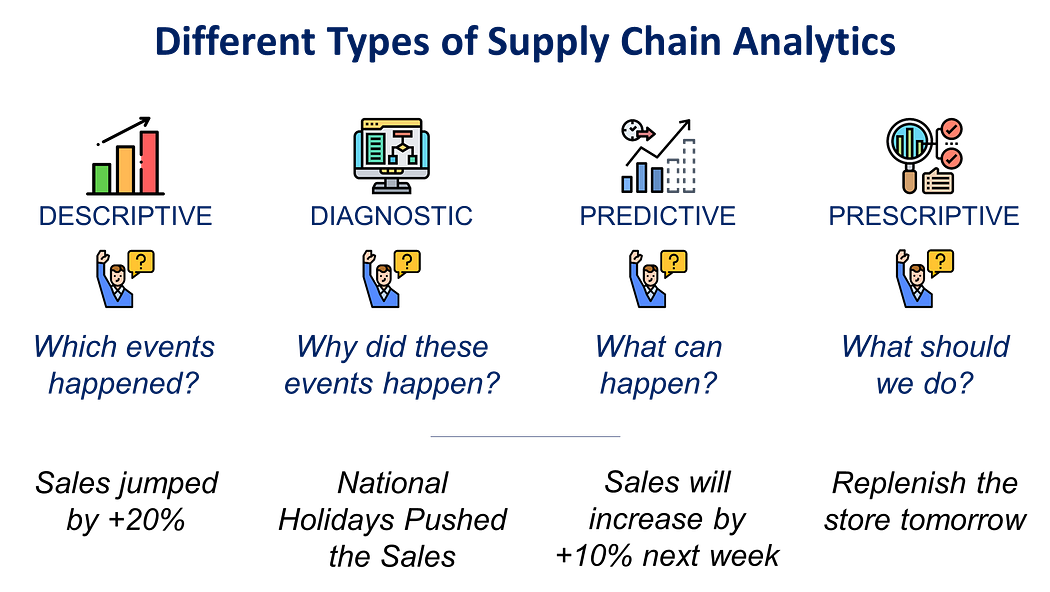
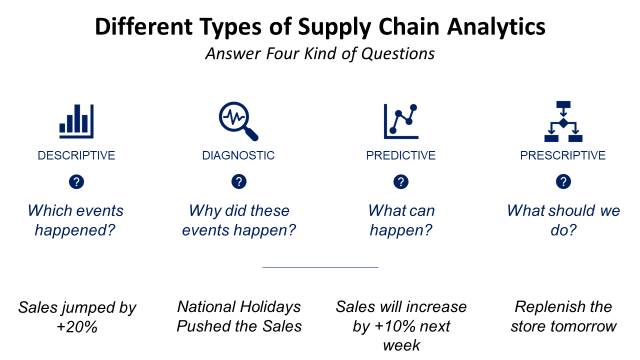
This valuable source of data can be used to
- Describe past events: Descriptive Analytics
- Analyze defects and incidents: Diagnostic Analytics
- Predict Future Events: Predictive Analytics
- Design Optimal Processes and Decisions: Prescriptive Analytics
Let’s dive deep into each type of analytics to understand how it relies on good EDI infrastructure.
Descriptive and Diagnostic Analytics
Descriptive analytics is about understanding what has happened in the past.
With a properly configured EDI setup, we can map historical transaction data to gain insights into past performance.
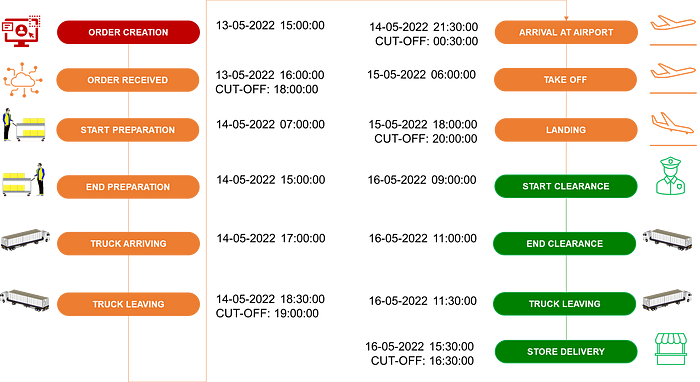
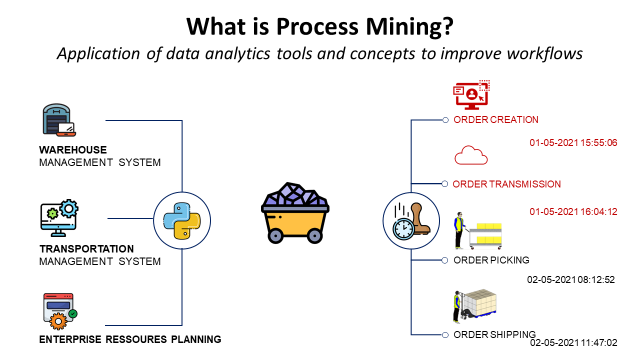
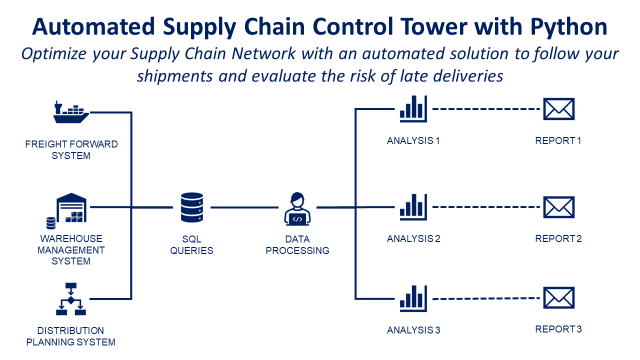
For instance, EDI messages can be status-updated at each stage of your distribution chain.
- Each event is linked with a time stamp (from Order Creation to Store Delivery)
- Actual Time Stamps can be compared with Expected Time Stamps
- Delays can then be analysed to find the root cause
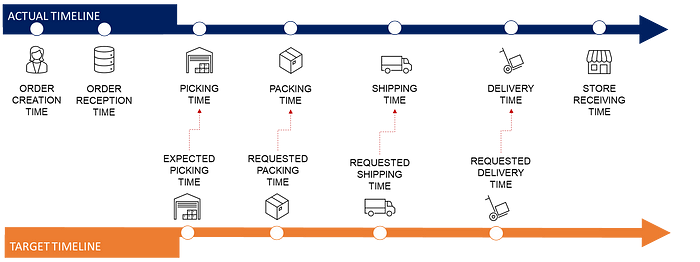
- Expected Times are calculated using target lead times agreed upon with operational teams
- ERP, WMS, Freight Forwarder Systems and Store Management Systems are all communicating timestamps using EDI
You can collect and process these timestamps to create automated reports that track shipments along the distribution chain.
💡 For more details,
What if we want to simulate events or failure in our logistic chain?
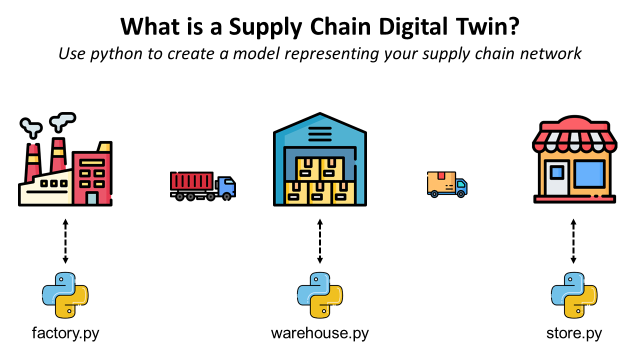
Digital Twin in Supply Chain Management
These computer models represent various supply chain components, including distribution centres, transportation networks, and manufacturing facilities.

EDI transactions can help you provide real-time data to keep the digital twin updated.
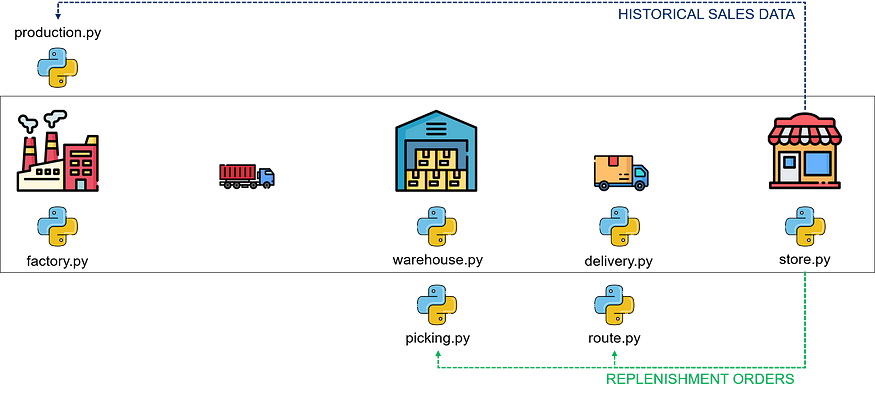
Let us assume that you have built a simple digital twin, including
- Models replicating transportation, store, warehouse and factory operations
- Connection along the chain replicating the information and goods flows
How can we exploit this data?
You can connect your EDI flow with:
- The warehouse model to estimate the time of picking up the batch of orders received in the EDI message
- The factory model compares the order quantity with the actual production capacity
This is a great tool for simulating and analysing different scenarios using real orders communicated via EDI without disrupting actual operations.
💡 For more details
Conclusion
Understanding the role of Electronic Data Interchange (EDI) in supply chain management helps us appreciate how data transmission is critical to modern business operations.
This pivotal technology provides the foundation for efficient communication between various computer systems.
What are the impacts on reporting?
Impact on Sustainability Reporting: ESG and Greenwashing
Environmental, Social and Governance (ESG) reporting is a method companies use to disclose their governance structures, societal impacts and environmental footprint.
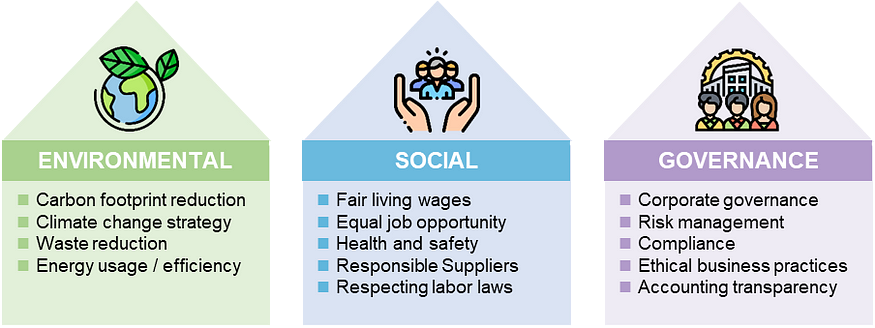
This non-financial reporting became a strategic aspect for companies, as it may affect consumers' perceptions and access to investments.
How can Electronic Data Interchange ensure data consistency and support auditing?
ESG reporting can be problematic due to the need for greater standardisation and the difficulty of ensuring data accuracy.
What happens if you feed your ESG report with wrong data?
Audits can become a risk for any company that wants to report this score officially.
Advanced Business Intelligence solutions can support data processing automation; EDI capabilities can help you ensure data traceability.
This can support the fight against greenwashing.
Greenwashing is the practice of communicating a false image of sustainability by making misleading claims about a product's environmental benefits.
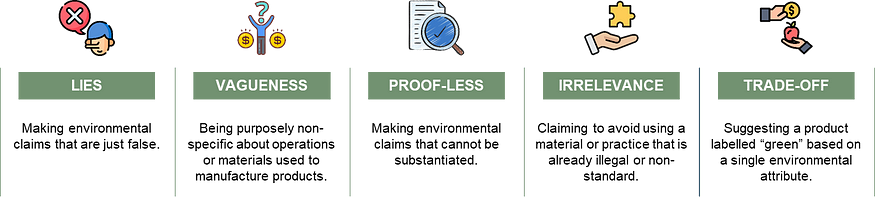
As general public awareness increases, companies have to put more effort into ensuring the accuracy of their calculation.
This relies on the proper collection, transmission and processing of transactional data supported by EDI technologies.
For more information about ESG reporting and greenwashing,


About Me
Let’s connect on LinkedIn and Twitter. I am a Supply Chain Engineer who uses data analytics to improve logistics operations and reduce costs.
For consulting or advice on analytics and sustainable supply chain transformation, feel free to contact me via Logigreen Consulting.