What is Sustainable Sourcing?
How can you use data analytics to select the best suppliers considering indicators for sustainability and social indicators?
Sustainable sourcing is the process of integrating social, ethical, and environmental performance factors into supplier selection.
This involves assessing suppliers against a set of sustainability criteria, including labour rights, health and safety, environmental impact, human rights, and more.
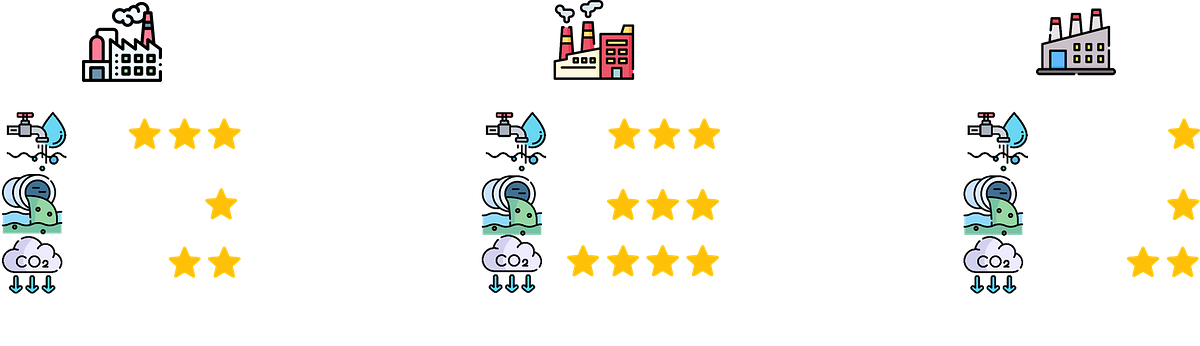
The aim is to minimize the negative impacts on the environment and maximize the positive social impacts.
Once you established measurable sustainability targets, you can use data analytics to assess suppliers' performances to select the best one to optimise your objective (cost reduction, CO2 emissions) while respecting social and environmental constraints.
Use data analytics to automatically select the best supplier with a mix of economic and environmental constraints
In this article, we will discover how to use data analytics to design an optimal Supply Chain Network to minimize costs and environmental impacts.
Sustainable Sourcing KPIs
Scenario: T-shirts Suppliers
Let us take the example used in the previous articles about life cycle assessment and circular economy.
You are a logistics performance manager in an international clothing group that has stores all around the world.
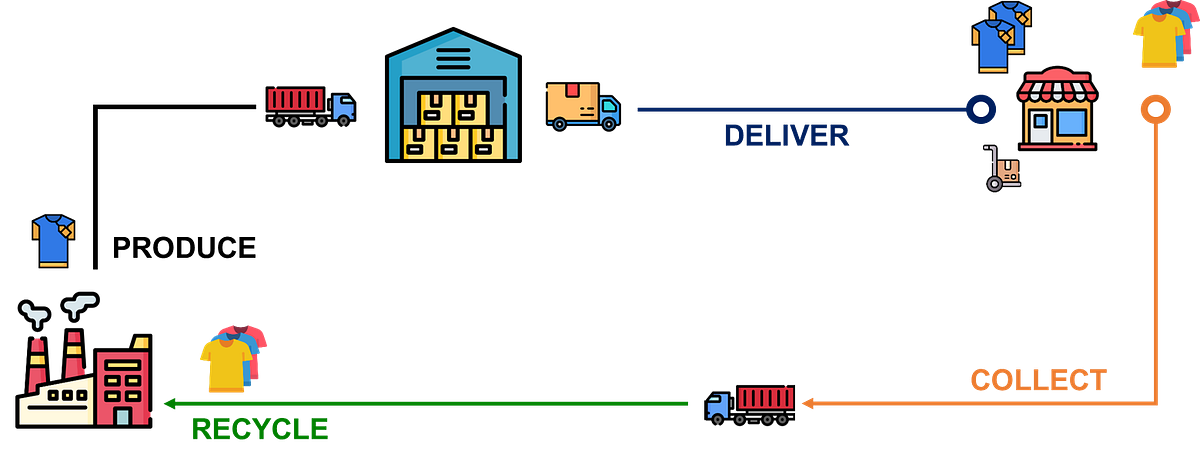
The company is sourcing garments, bags and accessories from factories located in Asia.
Stores are delivered from local warehouses replenished directly by factories.
How can you select t-shirt suppliers to minimize your costs while respecting environmental and social constraints?
Carbon emissions
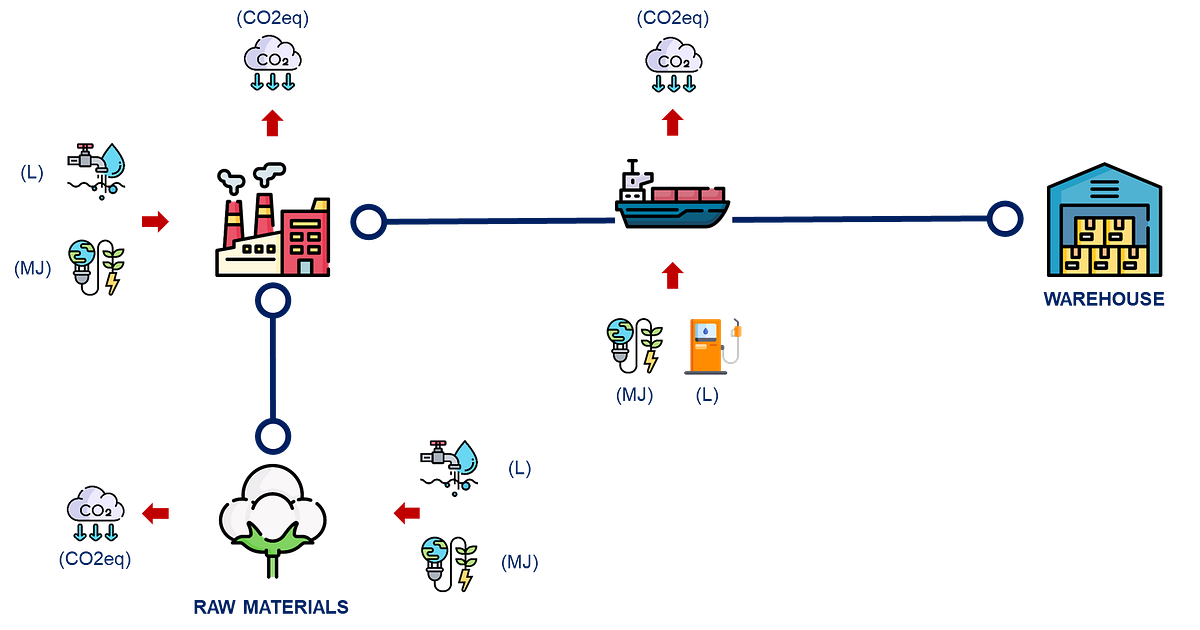
The primary indicator driving your sustainability roadmap is the supply chain's carbon footprint.
This can be measured by calculating total greenhouse gas emissions, such as carbon dioxide, methane, and nitrous oxide.
💡 What should we consider?
- Emissions during the cultivation of the cotton used for your t-shirts
- Emissions from electricity generation and chemicals used for t-shirt production
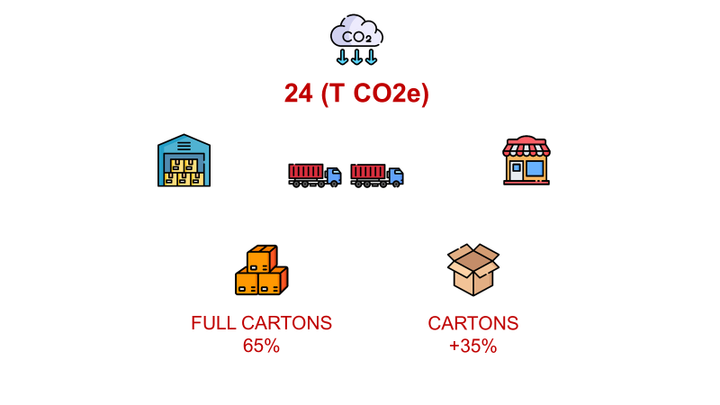
- Transportation of the finished goods (t-shirt) from the factory to the central distribution centre by sea-freight

With,
E_CO2: emissions in kilograms of CO2 equivalent (kgCO2eq)
W_goods: weight of the goods (Ton)
D: distance from your warehouse to the final destination(km)
F_mode: emissions factor for each transportation mode (kgCO2eq/t.km)
To learn more about transportation emissions calculation,
 Samir Saci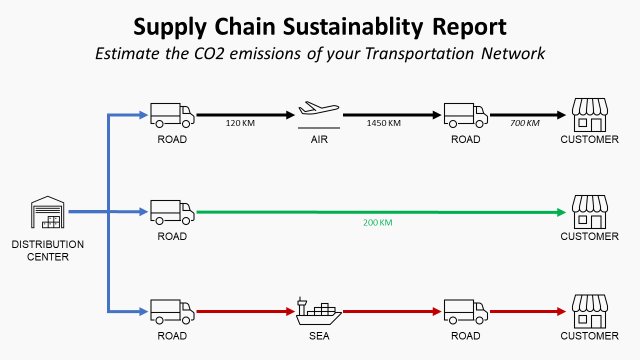
Energy consumption
Another indicator is the energy the supplier consumes to produce and deliver products.
It can be measured as the amount of energy used per production unit (called functional units in the Life Cycle Assessment Methodology).
💡 What should we consider?
- Energy consumption for cotton cultivation
- Energy consumption for spinning, weaving and dying
- Energy consumption for transportation
Water usage
As it becomes a scarce resource, new regulations are pushing companies to redesign their processes to reduce water consumption.
With this indicator, you can constrain your sourcing and focus on suppliers that do not affect the local water supply.
💡 What should we consider?
- Water consumption for cotton cultivation
- Water consumption for spinning, weaving and dying
Waste generation
Measuring waste generated during the production process can help identify areas for reducing waste and adopting more sustainable production methods.
💡 What should we consider?
- Solid waste generation during production
📊 How to organize data collection?
If you are a supplier and you need to provide this kind of reporting you can get the support of data analytics tools to automate it.
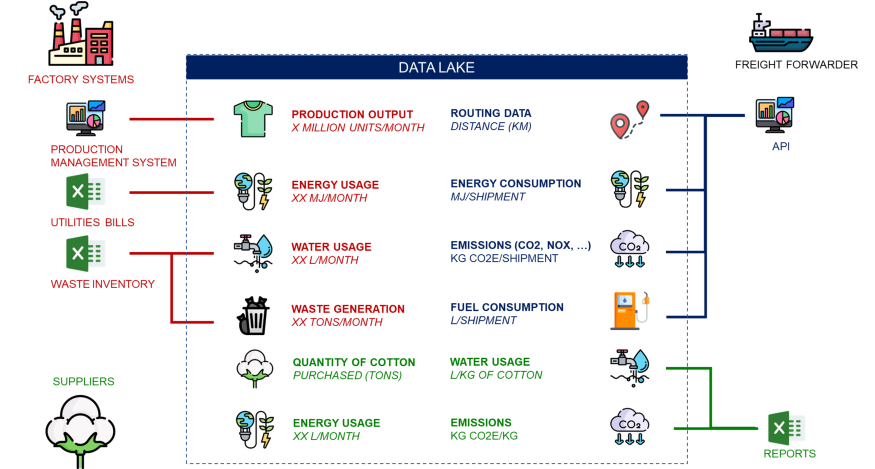
A data lake can be used as a central source of unstructured and structured data (databases, Excel files, …).
You can implement automated pipelines to extract, process and analyze these data to build reports and provide insights.
For more information, have a look at this article about life cycle assessment,
Samir Saci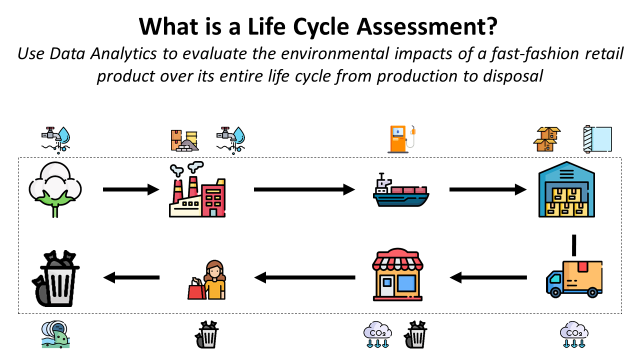
Social indicators
They include indicators for labour rights, fair pay, and safe working conditions to assess suppliers’ performance in terms of social sustainability.
You can conduct your own audits or use third-party assessments.
💡 How to Measure it?
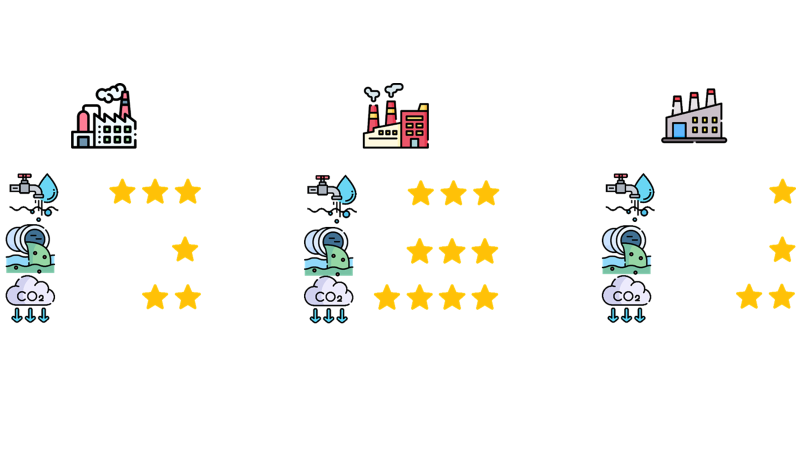
In the scorecard below, your company assigns a weight to each of the criteria, which represents the importance of that criteria in the overall evaluation.
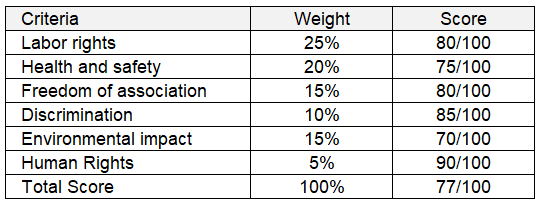
The auditors calculate a score linked to each criterion to represent the supplier’s performance.
The total score is calculated by multiplying each criterion’s score by its weight and summing the results.
Environmental indicators
They are used to assess if your suppliers are meeting environmental standards, focusing on energy efficiency, resource management, chemical usage and greenhouse gas emissions.
💡 How to Measure it?
A similar methodology can be applied using a scorecard.
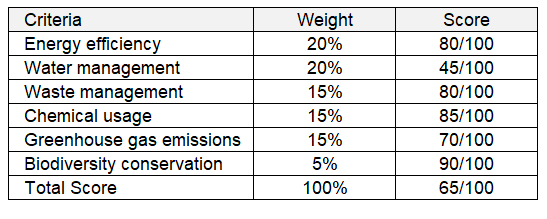
You can get support from governmental agencies and get checklists to support you in assessing the score for each criterion.
Sourcing Network Design
At this stage, you have collected information about your suppliers and performed audits with scoring.
You are now ready to use this data to drive decisions, design sourcing and logistics networks to deliver your stores.
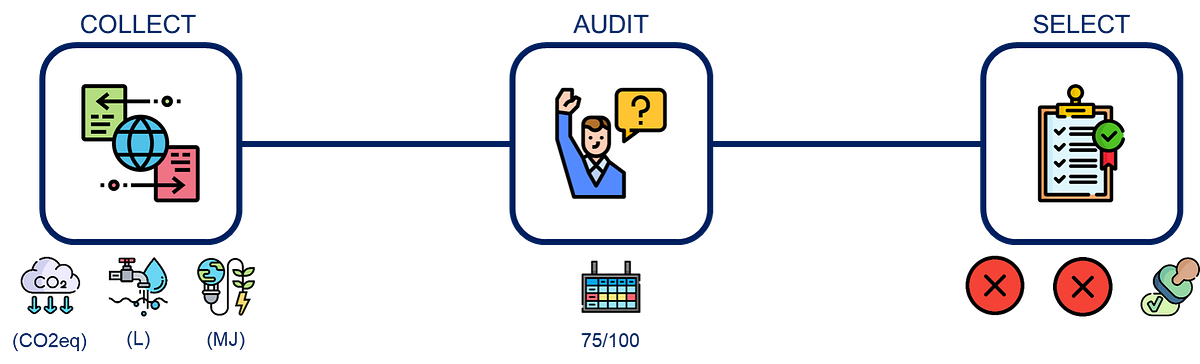
We will use an example with dummy data to understand how to implement a data-driven methodology to select your suppliers, considering environmental factors.
Problem Statement
You want to redefine the supply chain network for your fast-fashion retail company over the next 5 years.
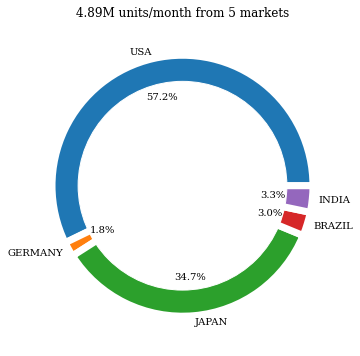
You have stores in 5 different markets around the world (USA, Germany, Japan, India and Brazil).
In each market, you can select a supplier to produce your t-shirts and you have the choice to source from abroad.
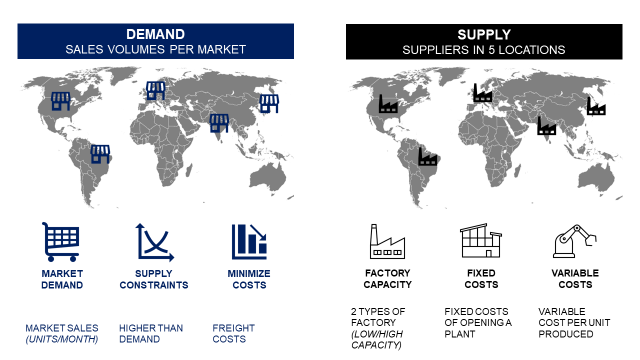
You would like to select the right set of suppliers to minimise the cost of production and delivery, considering
- The demand of each market (million units per month)
- Fixed and variable costs of production in each country
- Transportation costs from the factory to the market by sea freight
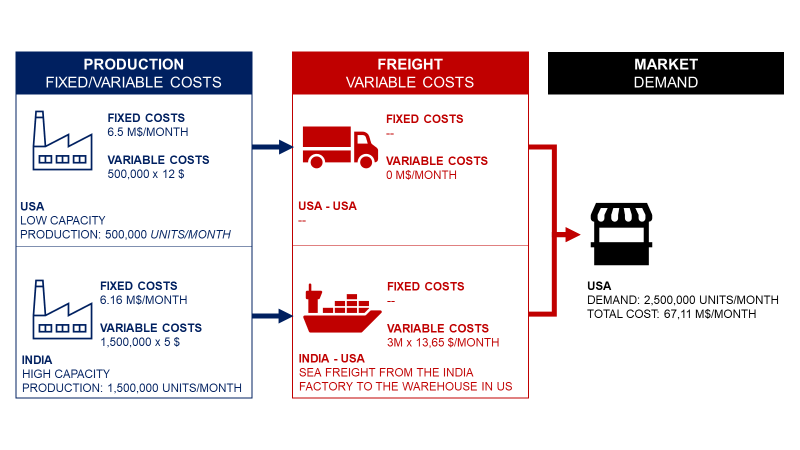
Your overseas suppliers are cheaper, but you need to pay high freight costs to deliver to your market.
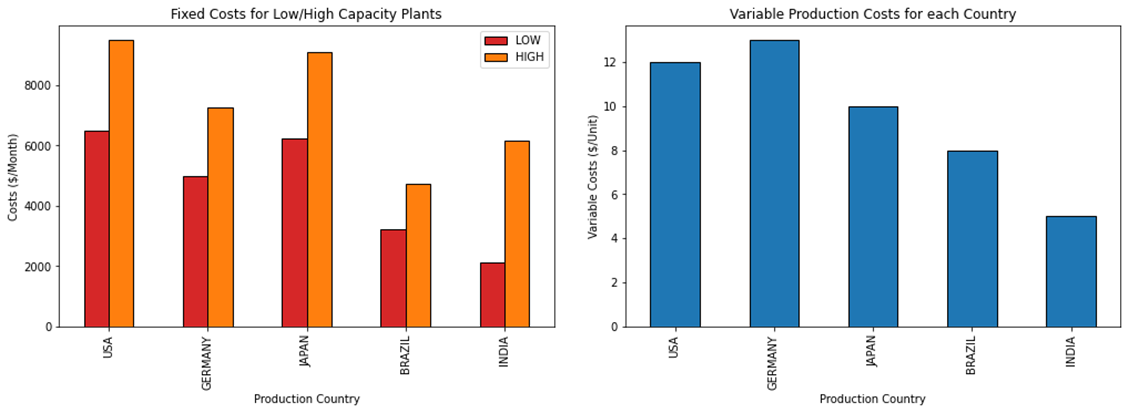
Therefore, you need the support of linear programming to make the tradeoff for outsourcing.
Initial Solution: Minimize Costs
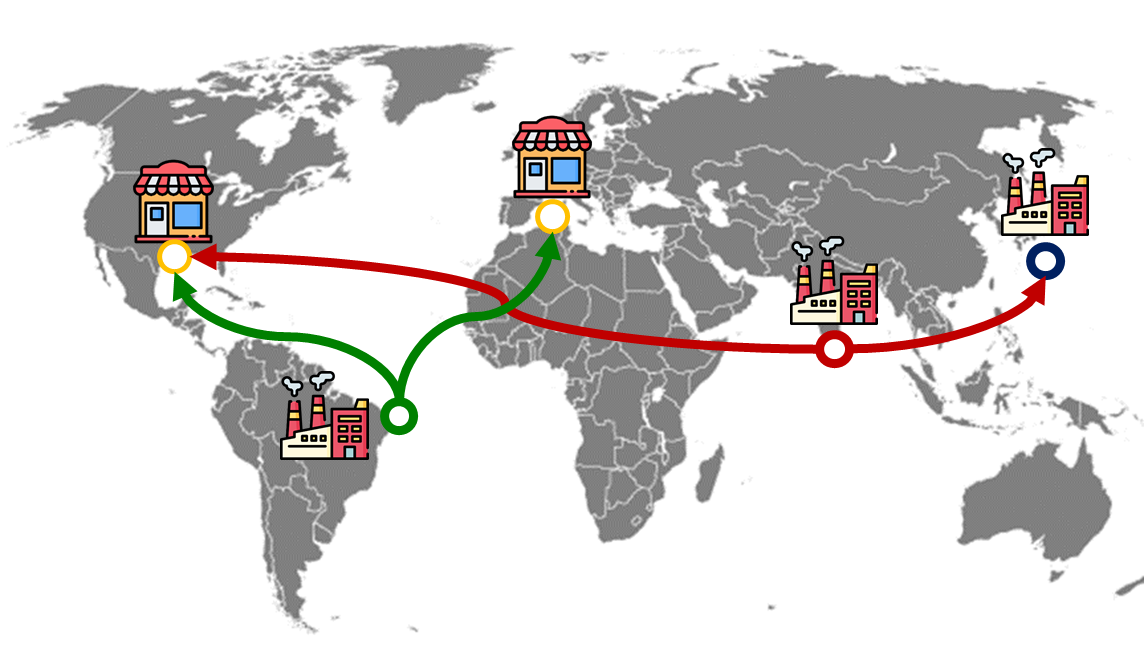
If you define the objective function to minimize the costs, you can easily guess that it will maximize the volume produced in India and Brazil.

💡 Insights
- In this case, the increased freight costs of sourcing overseas are compensated by the low production costs of India and Brazil
Sustainable Supply Chain
In the context of green transformation, your company is implementing a sustainability roadmap to reduce the environmental impacts of your supply chain.
Therefore, your procurement team has contacted local suppliers in your predominant markets (USA, Japan).
The idea is to redesign the network of suppliers, considering
- CO2 emissions from production and transportation
- Energy and water usage for production
- Waste generated by the factories
What would be the impact on your sourcing network?
Test 1: Energy and Water Savings Criterion
Let us experiment what would be the impact of implementing constraints on the average consumption of energy and water per unit produced.
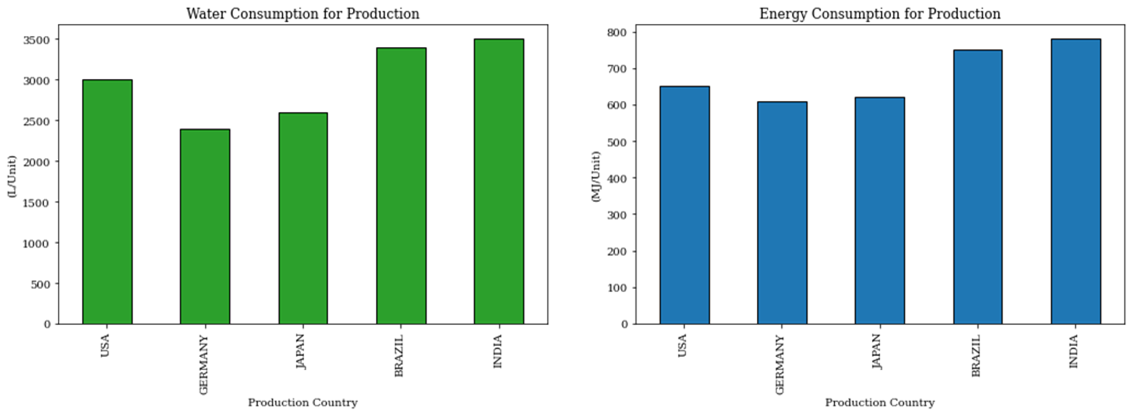
Your suppliers in Germany and Japan have invested in reducing the environmental impact of their operations.
You would like to add the following constraints
- Average water consumption below 3000 L/Unit
- Average energy usage below 685 MJ/Unit

💡 Insights
- The model decided to keep producing in India because of the very competitive costs
- But it has switched from Brazil to Germany to compensate for the impact and reduce the average water consumption of water and energy
- Germany and Japan are localizing their production
Test 2: Add CO2 emissions constraints
Transportation accounts for a large part of the CO2 footprint of your Supply Chain.
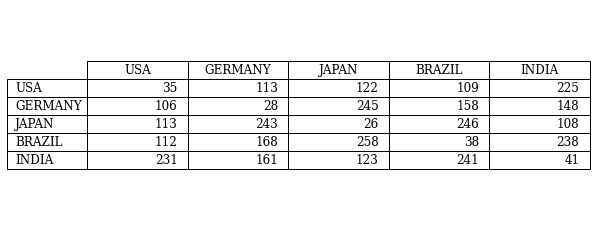
Therefore, you would like to reduce the impact of upstream flows by limiting the CO2 emissions of
- Cultivation and Production per unit kg CO2e/Unit
- Transportation by sea freight kg CO2e/Unit
- Total Emissions must be on average below 110 kg CO2e/Unit

💡 Insights
- For the first time, India has the lowest production output
- Brazil is a solution to keep manufacturing costs low while limiting CO2 emissions
- USA suppliers have not invested enough in sustainable production facilities to be retained for the domestic market supply
Conclusion
You can easily add constraints in your model of supplier selection to apply your green transformation initiatives.
In our example, we can see that CO2 emissions constraints can lead to a localization (quasi-localization) of the production to reduce the impact of transportation.
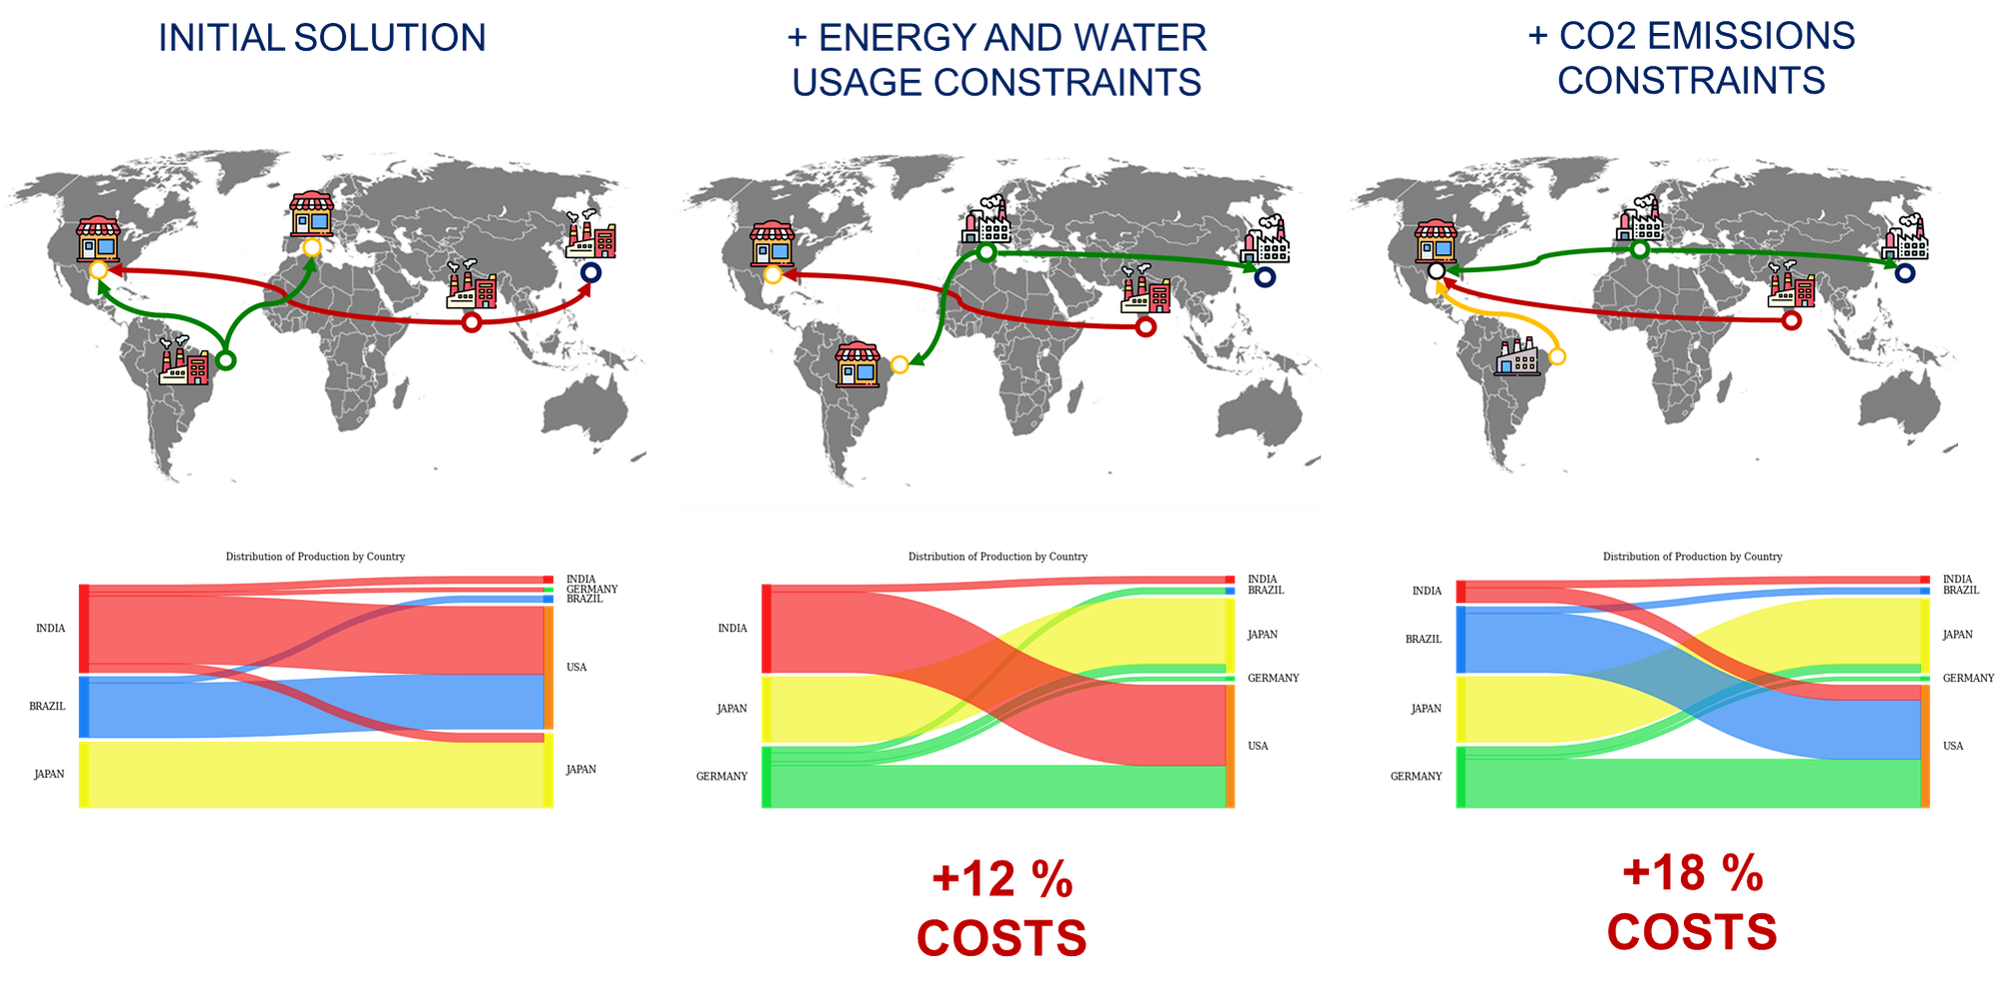
As you might expect, these additional constraints affect the total production costs.
These results can trigger strategic discussions to find the right balance between sustainable sourcing and cost reduction.
Can Generative AI support this process? Yes!
To support decision-makers in applying these insights to their sustainability roadmap, we have experimented with using GenAI to enhance the product.

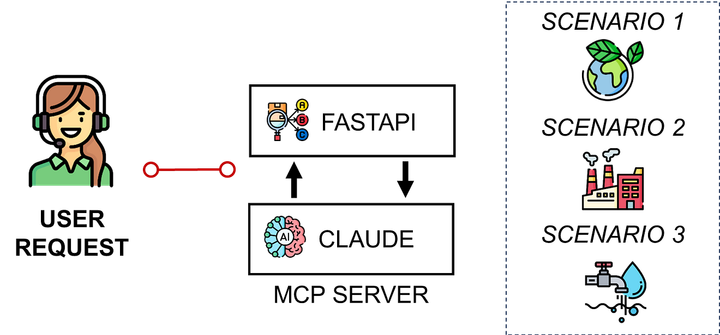
The idea is to connect Claude AI to an algorithm for sustainable sourcing (packaged as a FastAPI microservice) to help us simulate scenarios.
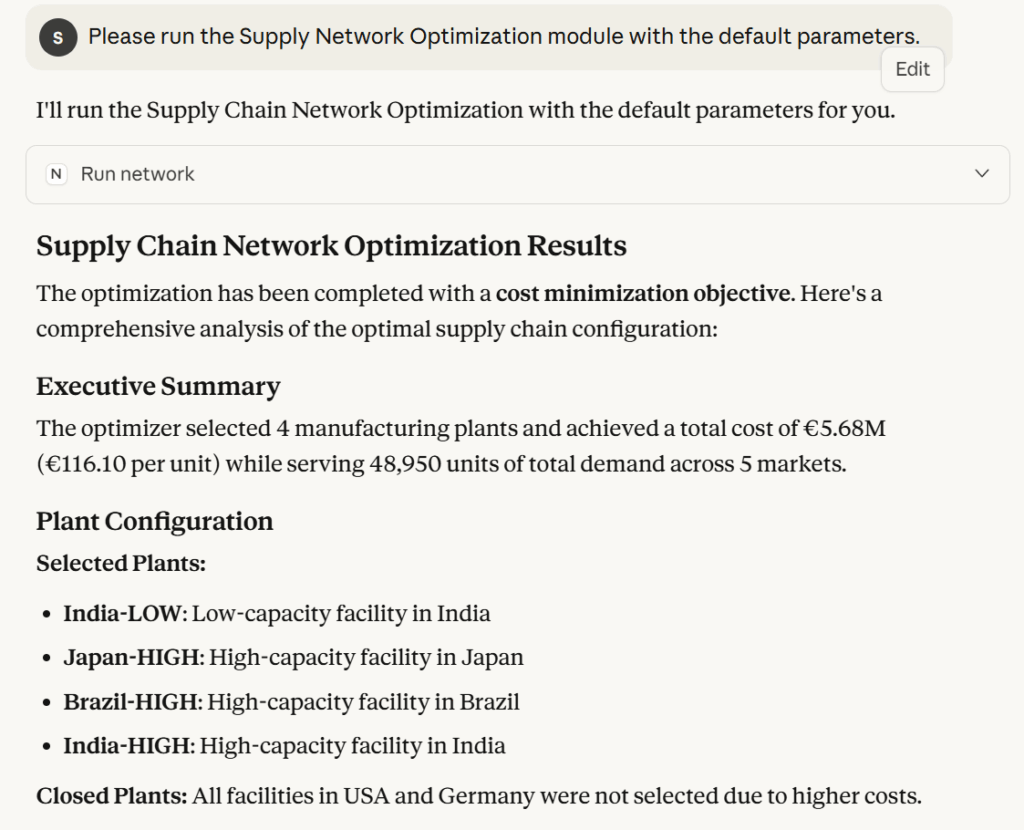
Using prompts, we teach Claude how to use the algorithm and explain the context of Supply Chain Network Optimisation.
We can then exploit its capabilities to guide us in selecting the different scenarios and analysing the results.
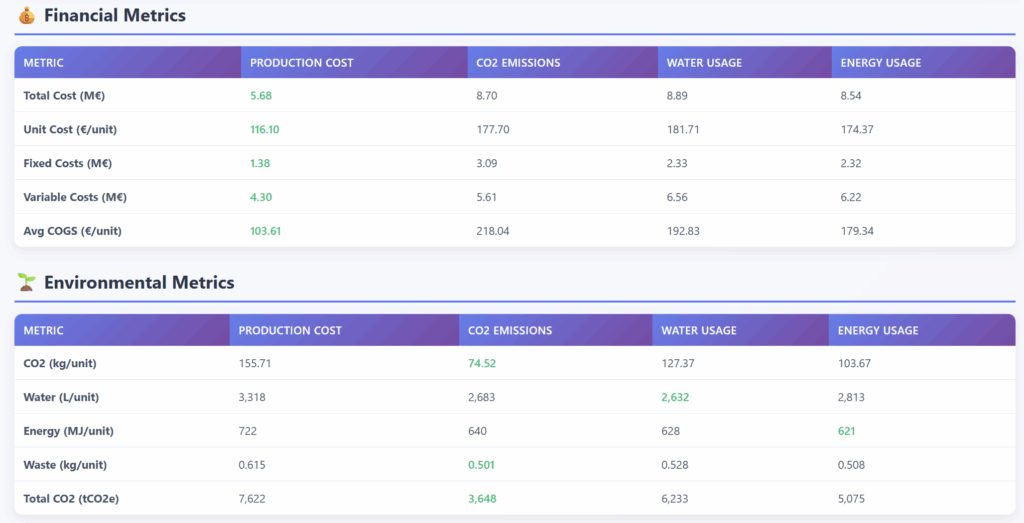
It is striking how well Claude summarises results in efficient, concise formats.
For more details, check out this complete case study and get more details in this video.
About Me
Let’s connect on LinkedIn and Twitter. I am a Supply Chain Engineer who is using data analytics to improve logistics operations and reduce costs.
If you’re looking for tailored consulting solutions to optimize your supply chain and meet sustainability goals, feel free to contact me.